Type 2 diabetes

Page highlights:

How many people are living with type 2 diabetes in Australia?

  • Almost 1.2 million (4.6%) people were living with type 2 diabetes in Australia in 2021.
  • Overall, males were 1.3 times as likely to be living with type 2 diabetes as females.
  • In 2018–19, an estimated 10.7% (51,900) Aboriginal and Torres Strait Islander people were living with type 2 diabetes.
  • Type 2 diabetes prevalence increased with both the level of remoteness and socioeconomic disadvantage.

How many people are newly diagnosed with type 2 diabetes in Australia?

  • Around 45,700 people were newly diagnosed (incidence) with type 2 diabetes in Australia in 2021, around 125 people a day.
  • Males were 1.4 times as likely to be newly diagnosed with type 2 diabetes as females.
  • Type 2 diabetes incidence rates have almost halved since 2008.

How many people are living with type 2 diabetes in Australia?

Almost 1.2 million (4.6%) Australians were living with type 2 diabetes and registered with the National Diabetes Services Scheme (NDSS) and Australasian Paediatric Endocrine Group (APEG) state-based registers in 2021. 

Variation by age and sex

In 2021, the prevalence of type 2 diabetes, based on linked NDSS and APEG data, increased with increasing age. Of the almost 1.2 million Australians living with type 2 diabetes, 3.1% were aged less than 40 while 59% were aged 65 or over. Type 2 diabetes prevalence peaked in the 80–84 age group (22% and 17% for males and females, respectively) (Figure 1).

Overall, age-standardised type 2 diabetes prevalence rates were 1.3 times as high in males compared with females.

Figure 1: Prevalence of type 2 diabetes, by age and sex, 2021

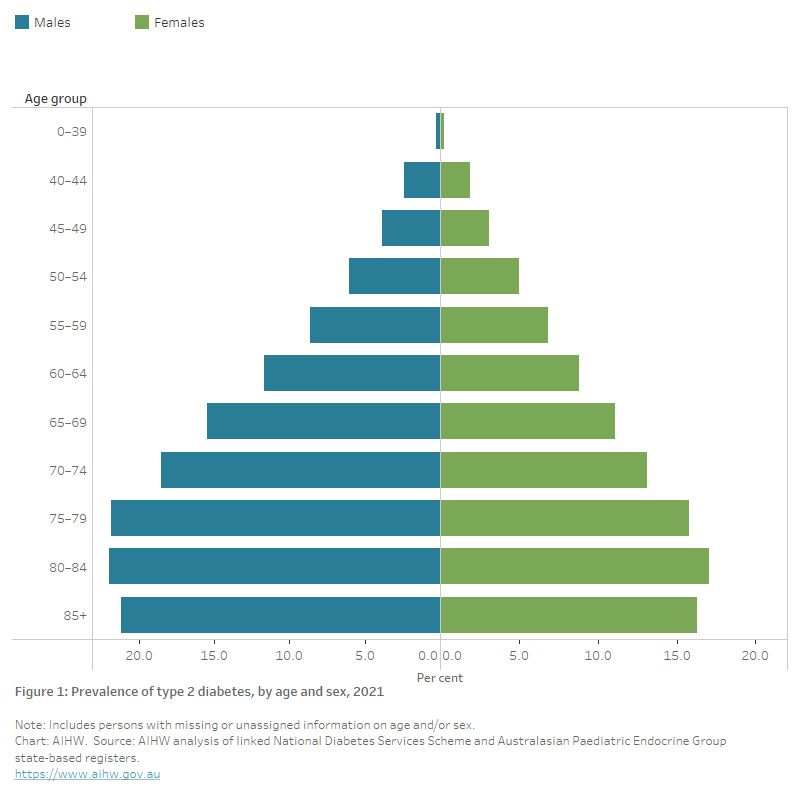
The butterfly chart shows the prevalence of type 2 diabetes by age groups in 2021. Rates were highest among males and females aged 80–84 (22% and 17%).

Trends over time

The number of people living with type 2 diabetes in Australia increased almost 3-fold between 2000 and 2021, from around 400,000 to almost 1.2 million.

After adjusting for differences in the age structure of the population, the proportion of people living with type 2 diabetes almost doubled between 2000 and 2013, and has remained relatively stable in the last decade (Figure 2). Since 2008, the age-standardised prevalence of type 2 diabetes has consistently been 1.3 times as high among males as females. 

Similar patterns were found in the National Health Survey (NHS). The age-standardised prevalence rate of type 2 diabetes increased by 37% overall between 2001 and 2017–18 (Figure 3).

Note: The true prevalence of diabetes (including type 2 diabetes) is likely to be underestimated in the Australian population. Refer to Limitations of estimating diabetes prevalence data for more information.

Figure 2: Prevalence of type 2 diabetes from the linked NDSS and APEG data, by sex, 2000–2021

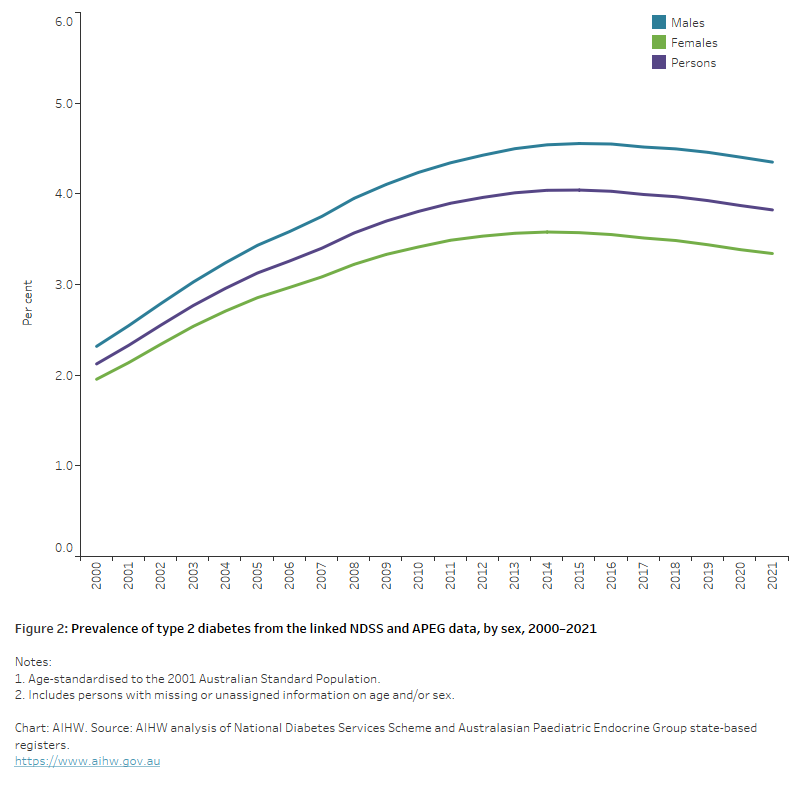
The chart shows the increase in the age-standardised rates of males and females living with type 2 diabetes between 2000 to 2021, from 2.3% to 4.3% for males, and from 2.0% to 3.3% for females.

Figure 3: Prevalence of self-reported type 2 diabetes among adults 18+, by sex, 2001 to 2017–18 (National Health Survey data)

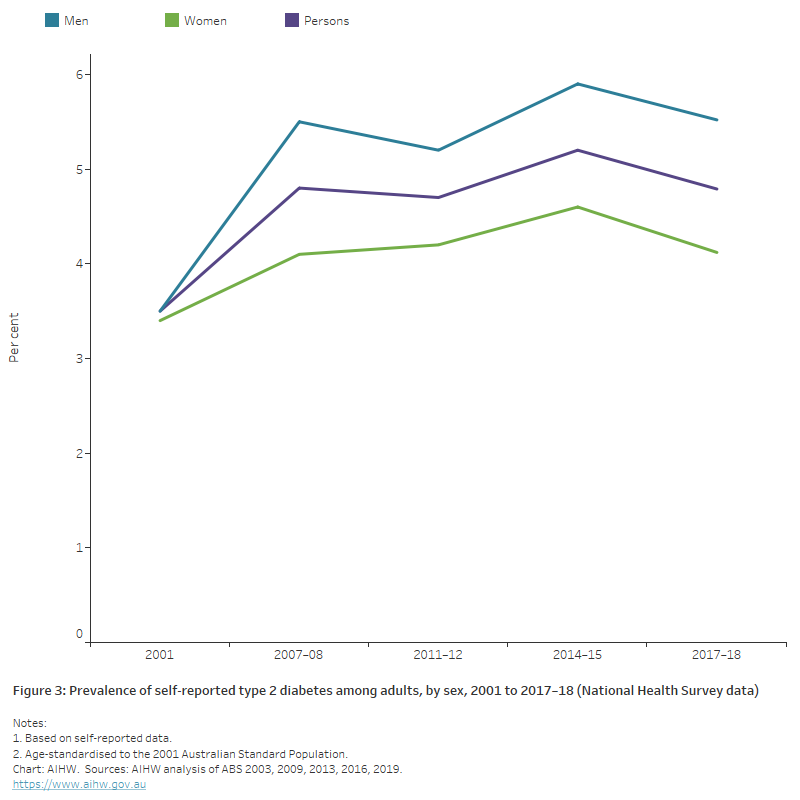
The line chart shows the increase in the age-standardised rates of males and females living with type 2 diabetes between 2001 to 2017–18, from 3.5% to 5.5% for males, and from 3.4% to 4.1% for females.

Variation between population groups

Aboriginal and Torres Strait Islander people

Among Aboriginal and Torres Strait Islander adults (aged 18+) in 2018–19, an estimated 10.7% (51,900 people) were living with type 2 diabetes, based on self-reported data from the ABS National Aboriginal and Torres Strait Islander Health Survey (NATSIHS). The age-standardised prevalence of type 2 diabetes was similar among Indigenous men and women.

Based on estimates from the 2018–19 NATSIHS and 2017–18 NHS, after adjusting for differences in the age structure of the populations, Indigenous adults were 2.9 times as likely to be living with type 2 diabetes as non-Indigenous adults.

For more information about issues with reporting Indigenous type 2 diabetes prevalence data from the linked NDSS and APEG data refer to Using the NDSS for reporting on Indigenous Australians.

Remoteness area

In 2021, the prevalence of type 2 diabetes (based on linked NDSS and APEG data) generally increased with increasing remoteness area. Age-standardised rates among people living in Remote and very remote areas were 1.4 and 1.5 times as high as those living in Major Cities and Inner regional areas, respectively. This disparity was more pronounced among females than males (Figure 4).

See Geographical variation in disease: diabetes, cardiovascular and chronic kidney disease for more information on the prevalence of type 2 diabetes by state/territory, Population Health Network and Population Health Area.

Socioeconomic area

In 2021, the prevalence of type 2 diabetes (based on linked NDSS and APEG data) increased with the level of socioeconomic disadvantage. Age-standardised rates were almost twice as high among those living in the lowest socioeconomic areas as in the highest socioeconomic areas.  This disparity was more evident among females than males (2.1 and 1.7 times as high, respectively) (Figure 4).

Figure 4: Prevalence of type 2 diabetes, by selected population group and sex, 2021

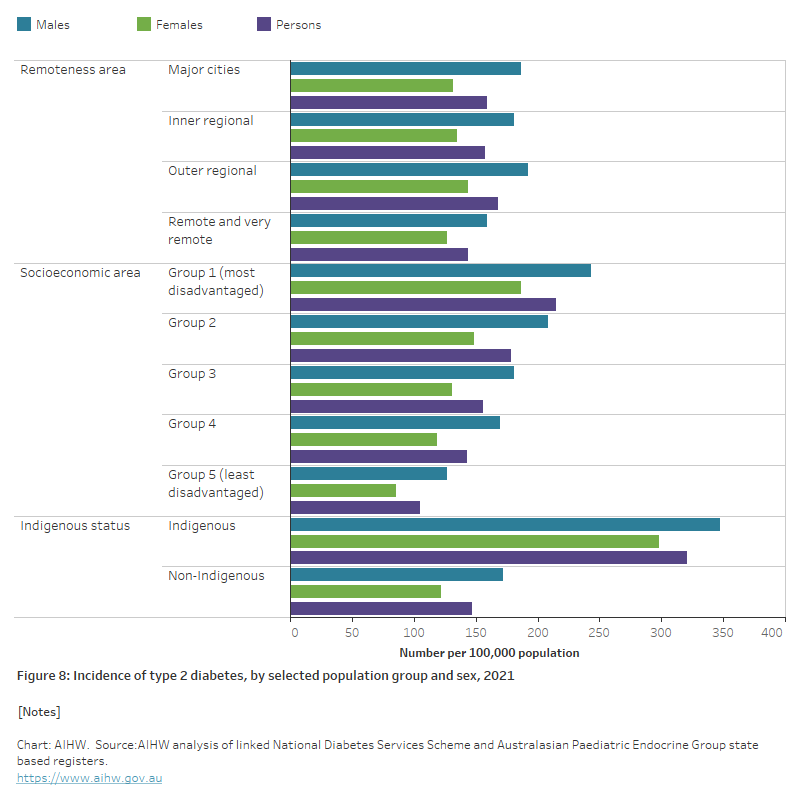
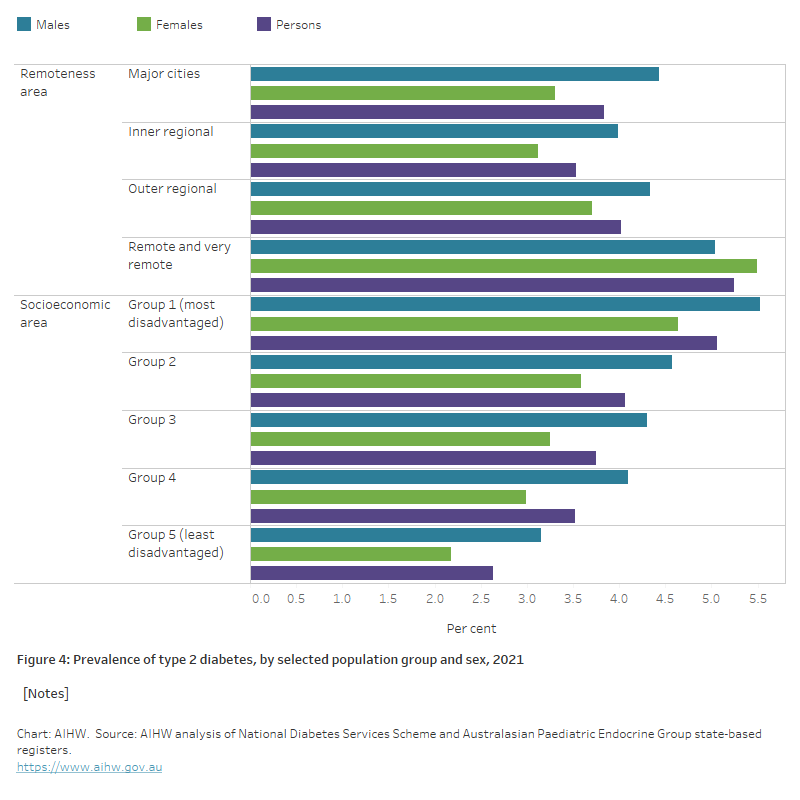
The chart shows that male and female type 2 diabetes prevalence rates in 2021, were higher among people living in remote and very remote areas, and people living in the lowest socioeconomic areas.

How many people are newly diagnosed with type 2 diabetes in Australia?

According to linked NDSS and APEG data, over 1.3 million people were newly diagnosed (incidence) with type 2 diabetes between 2000 and 2021. This is approximately 60,400 people each year – an average of 165 newly diagnosed people a day.

There were just over 45,700 people newly diagnosed with type 2 diabetes in Australia in 2021, around 125 people a day.

Variation by age and sex

In 2021, type 2 diabetes incidence rates were highest among males and females aged 65–69 according to linked NDSS and APEG data (515 and 383 per 100,000 population, respectively) (Figure 5).

After adjusting for the different age structures of the populations, type 2 diabetes incidence rates were 1.4 times as high among males as females.

Figure 5: Incidence of type 2 diabetes, by age and sex, 2021

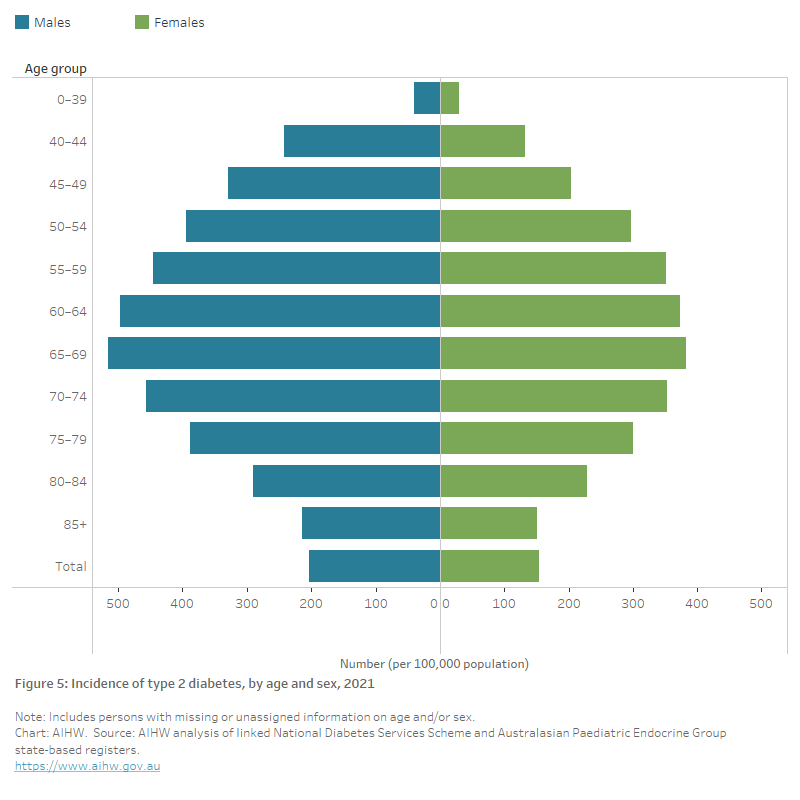
The chart shows the type 2 diabetes incidence rates by age group and sex in 2021. Rates were highest among males and females aged 65–69 (515 and 383 per 100,000 population).

Trends over time

There has been a steady decline in the age-standardised incidence rate for type 2 diabetes in Australia between 2000 and 2021, with an overall drop of 43% (Figure 6). Although evidence from the 2019 Global Burden of Disease study as reported in The Lancet (2020), shows an overall increase in incidence globally, the observed declining trend has also been reported in a number of other countries (Magliano et al. 2019; Magliano et al. 2021). The fall in incidence may be due to improved preventive measures such as screening, increased awareness and educational programs leading to behavioural changes and risk factor modification (Magliano et al. 2019; Shrapnel and Butcher 2020).

Note: Some caution should be used when interpreting these trends. The NDSS is estimated to capture 80–90% of all people with diagnosed diabetes in Australia (AIHW 2009). It is uncertain how many people with diagnosed diabetes have not registered with the NDSS and how many people are living with undiagnosed diabetes. The under-representation of Indigenous Australians on the NDSS is a further factor for consideration.

Figure 6: Incidence of type 2 diabetes, by age and sex, 2000–2021

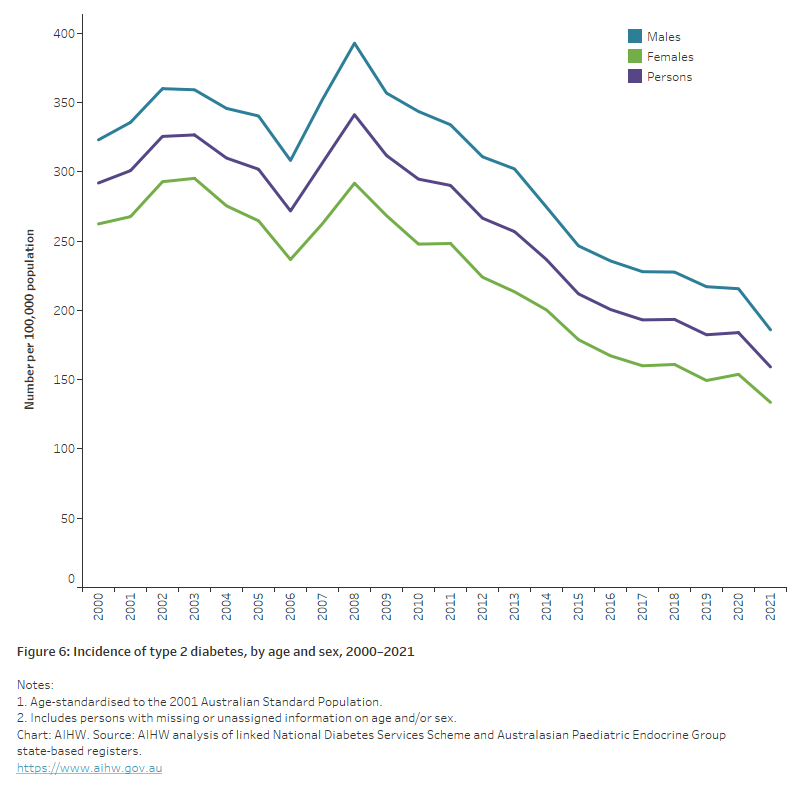
The chart shows declines in the age-standardised incidence rates of males and females newly diagnosed with type 2 diabetes between 2000 to 2021, from 292 to 159 per 100,000 population, overall.

Variation between population groups

Aboriginal and Torres Strait Islander

Around 2,000 Aboriginal and Torres Strait Islander people were newly diagnosed with type 2 diabetes in 2021 (based on linked NDSS and APEG data), equating to 225 diagnoses per 100,00 population. Age-standardised incidence rates were 1.2 times as high among Indigenous males as females. Rates were highest among Indigenous males aged 65–69 and Indigenous females aged 60–64 (914 and 699 per 100,000, respectively) (Figure 7).

After controlling for age, type 2 diabetes incidence rates were 2.2 times as high among Indigenous Australians as non-Indigenous Australians (Figure 8).

Figure 7: Incidence of type 2 diabetes, Aboriginal and Torres Strait Islander people, by age and sex, 2021

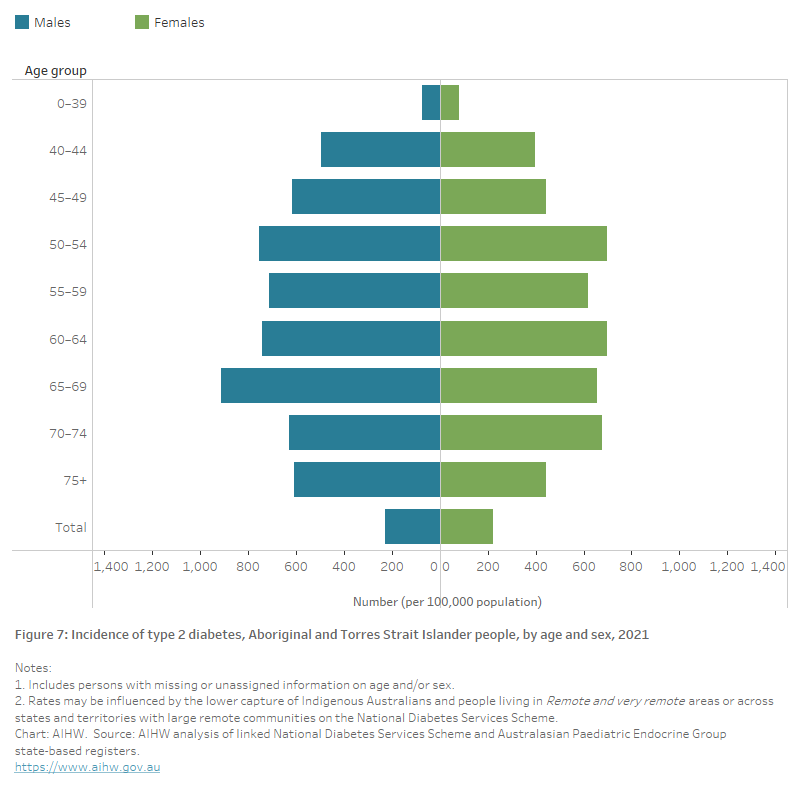
The chart shows the incidence of type 2 diabetes among Aboriginal and Torres Strait Islander people by age group in 2021. Rates were highest among Indigenous males aged 65–69 and females aged 60–64 (1,391 and 1,048 per 100,000 population).

Remoteness area

Based on linked NDSS and APEG data, the incidence of type 2 diabetes in 2021 was slightly higher among those living in Outer regional areas, that is 1.1 and 1.2 times as high as those living in Major cities and Remote and very remote areas, respectively (Figure 8).

Socioeconomic area

In 2021, the incidence of type 2 diabetes (based on linked NDSS and APEG data) increased with increasing levels of socioeconomic disadvantage. Rates were around 2.0 times as high among those living in the lowest socioeconomic areas as in the highest socioeconomic areas (Figure 8).

Figure 8: Incidence of type 2 diabetes, by selected population groups and sex, 2021

The chart shows that male and female type 2 diabetes prevalence rates in 2021, were higher among Indigenous Australians, people living in outer regional areas, and people living in the lowest socioeconomic areas.