Hospitalisations
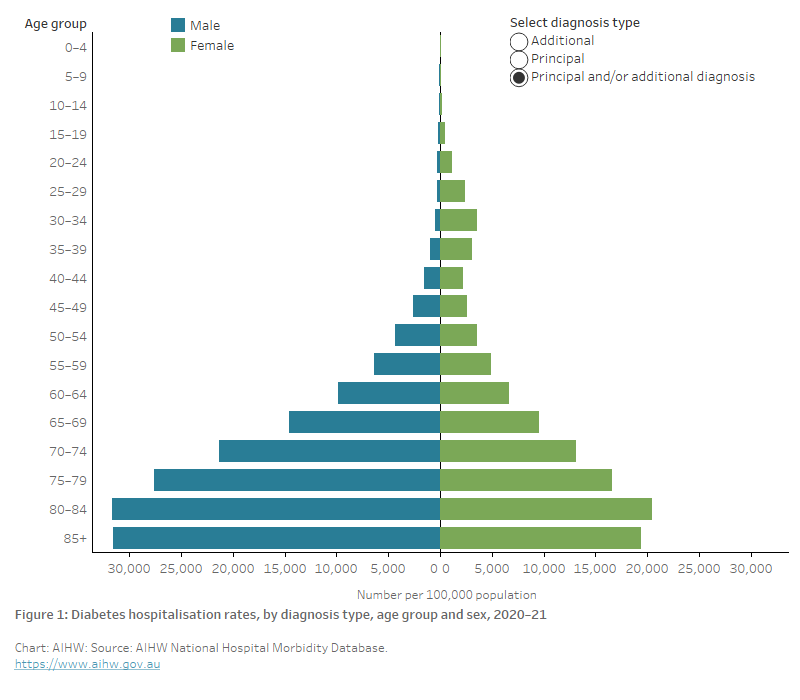
The chart shows hospitalisation rates with diabetes as the principal and/or additional diagnosis peaked in the 80–84 age group with 31,670 and 20,451 hospitalisations for males and females, respectively, per 100,000 population. With diabetes as the principal diagnosis, rates peaked among males aged 80–84 and females aged 85 and over (1,160 and 570 per 100,000 population, respectively). Rates with diabetes as an additional diagnosis peaked in the 80–84 age group with 30,510 and 19,881 per 100,000 population, respectively.
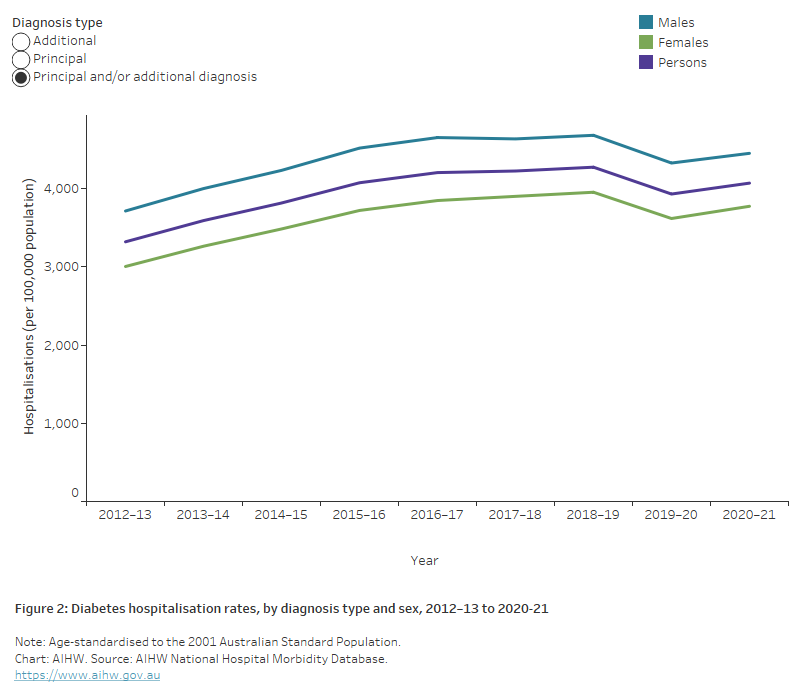
The chart shows the increasing trend in the rate of hospitalisations with diabetes as the principal and/or additional diagnosis, by sex from 2012-13 to 2019–20, for both males and females. Rates among males have consistently been around 1.2 times higher than among females. Hospitalisation rates peaked in 2018-19 at 4,268 per 100,000 population per year and declined slightly to 3,924 per 100,000 population in 2019-20. Hospitalisation rates with diabetes as a principal diagnosis have increased more gradually since 2012–13, and continued to record an increase in 2019–20 for males only.
The chart shows the rate of hospitalisations for diabetes, by diagnosis type from 2000–01 to 2019–20. Hospitalisation rates with a principal diagnosis of diabetes remained steady between 2000–01 to 2009–10 followed by a drop from 424 to 176 per 100,000 population in 2010–11 and have remained steady to 2019–20. Hospitalisation rates with an additional diagnosis of diabetes increased from 1,671 per 100,000 population in 2000–01 to 2,584 per 100,000 population in 2007–08 then declined to 766 per 100,000 population in 2010–11 before showing an increasing trend between 2011–12 and 2019–20 peaking at 4,055 per 100,000 population in 2018–19.

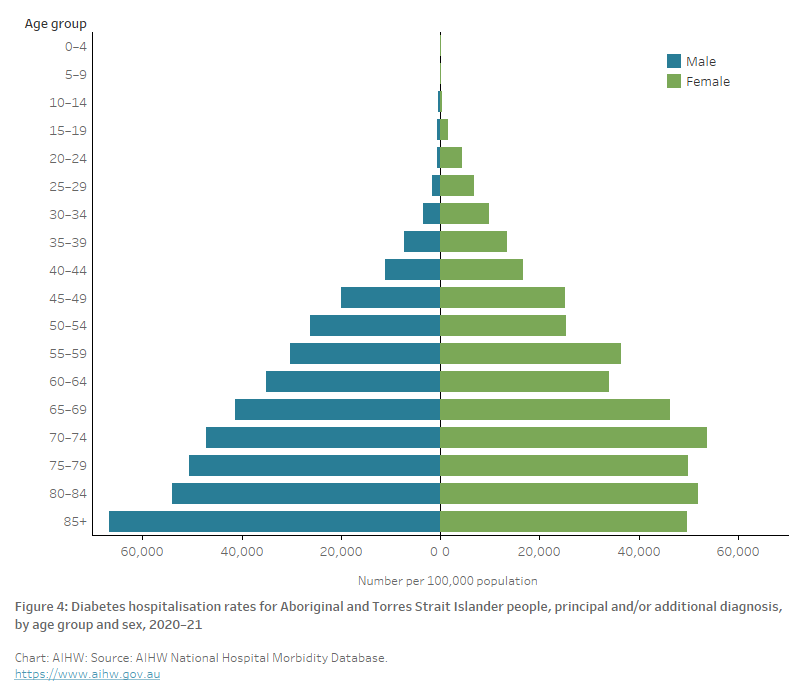
The bar chart shows hospitalisations with diabetes as the principal and/or additional diagnosis for Aboriginal and Torres Strait Islander people, by sex for 2020–21. Rates peaked for males in the 85+ year age group with 66,800 hospitalisations per 100,000 population and for females in the 70–74-year age group with 53,800 hospitalisations per 100,000 population.
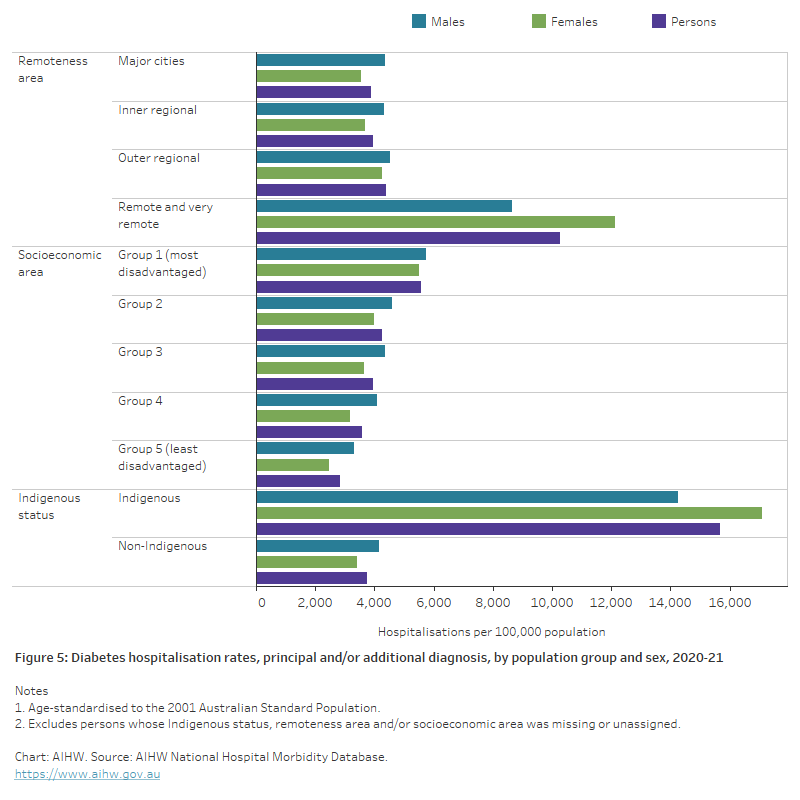
The bar chart shows hospitalisations with diabetes as the principal and/or additional diagnosis, by population group and sex for 2019–20. Rates increased with increasing remoteness and were highest among people living in Remote and very remote areas at 9,980 per 100,000 population compared to 3,720 per 100,000 population living in Major cities. Hospitalisation rates also increased gradually with increasing socioeconomic disadvantage. Those living in the most disadvantaged areas had the highest hospitalisation rates with 4,870 per 100,000 population compared with those living in the least disadvantaged areas with 2,777 per 100,000 population. Diabetes hospitalisation rates were 4.3 times higher among Aboriginal and Torres Strait Islander people compared with non-Indigenous people.
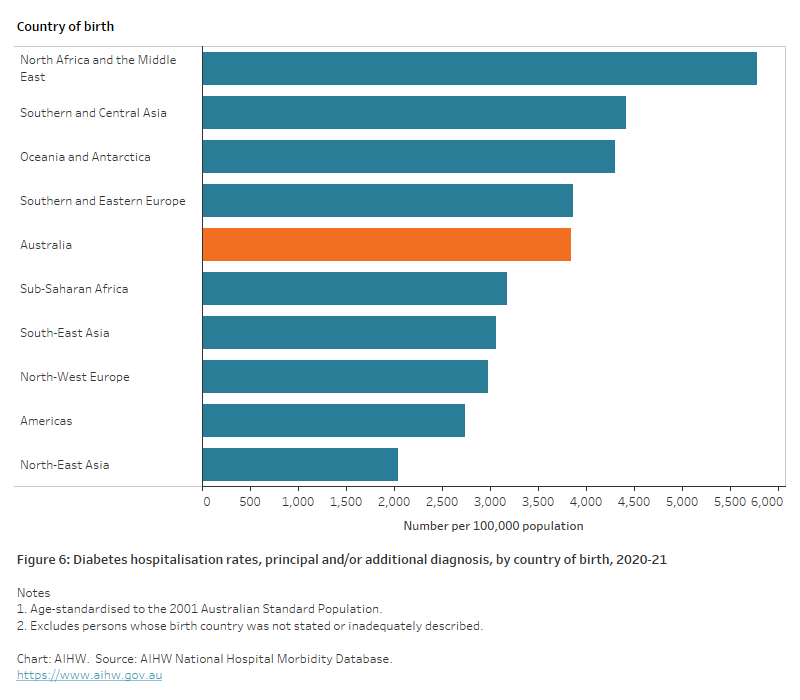
The chart shows the age-standardised hospitalisation rates with diabetes as the principal and/or additional diagnosis, by country of birth for 2019–20. Diabetes hospitalisation rates were 1.5 times as high among those born in North Africa and The Middle East as those born in Australia.
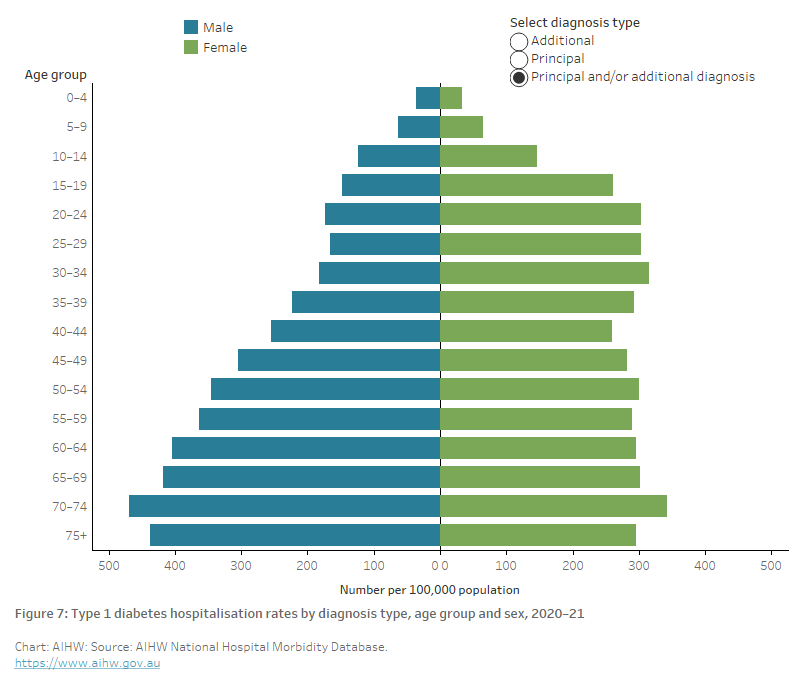
The bar chart shows hospitalisations with type 1 diabetes as the principal and/or additional diagnosis peaked in the 70–74-year age group with 470 and 342 hospitalisations for males and females, respectively, per 100,000 population.
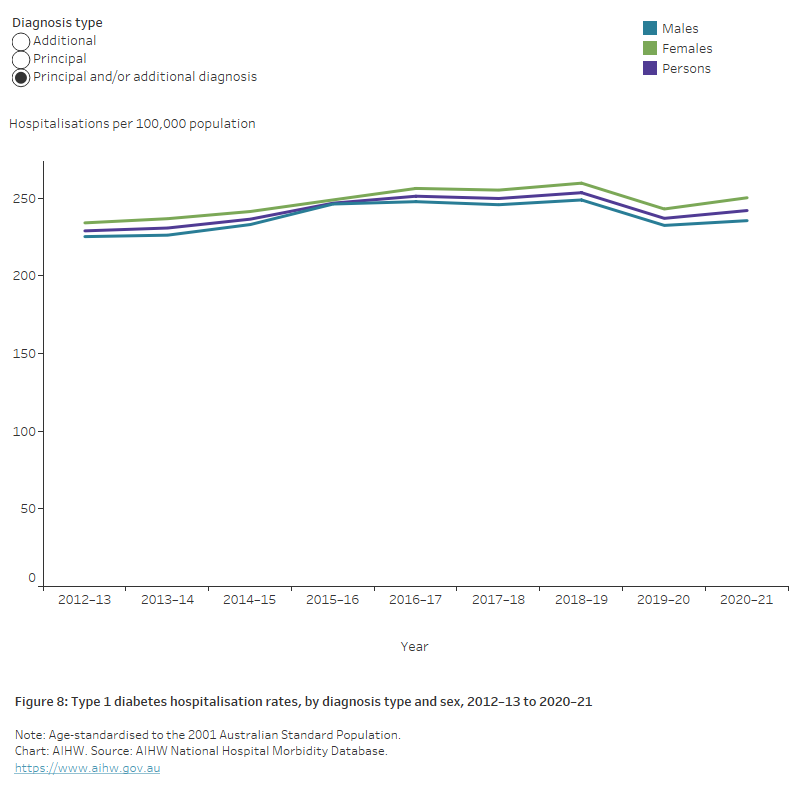
The chart shows hospitalisations rates for type 1 diabetes as the principal and/or additional diagnosis increased by 5.7% between 2012–13 and 2020–21 with the rates consistently slightly higher among females than males over this period.
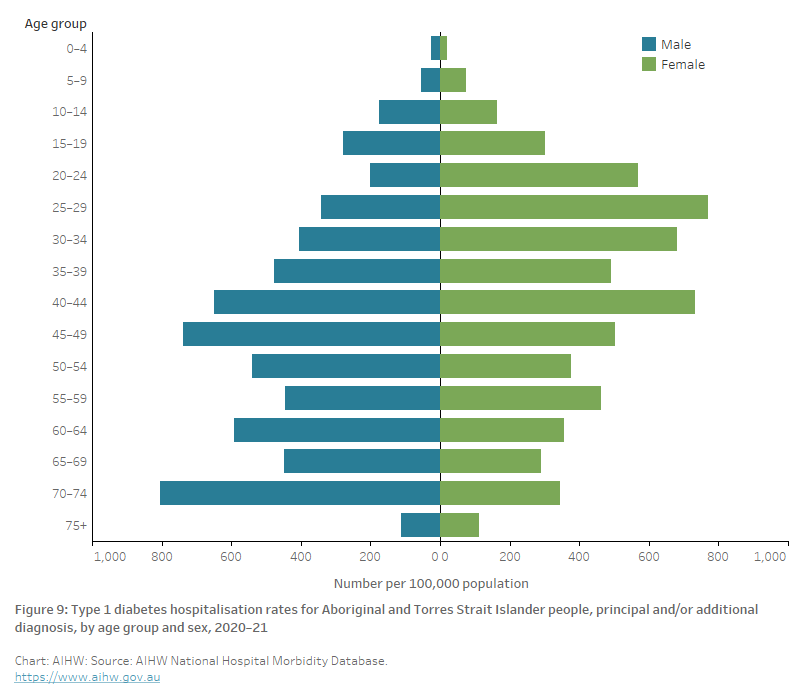
The chart shows hospitalisations with type 1 diabetes as the principal and/or additional diagnosis for Aboriginal and Torres Strait Islander people, by sex for 2020–21. Rates peaked for males in the 70–74 age group with 803 hospitalisations per 100,000 population and for females in the 25–29 age group with 771 hospitalisations per 100,000 population.
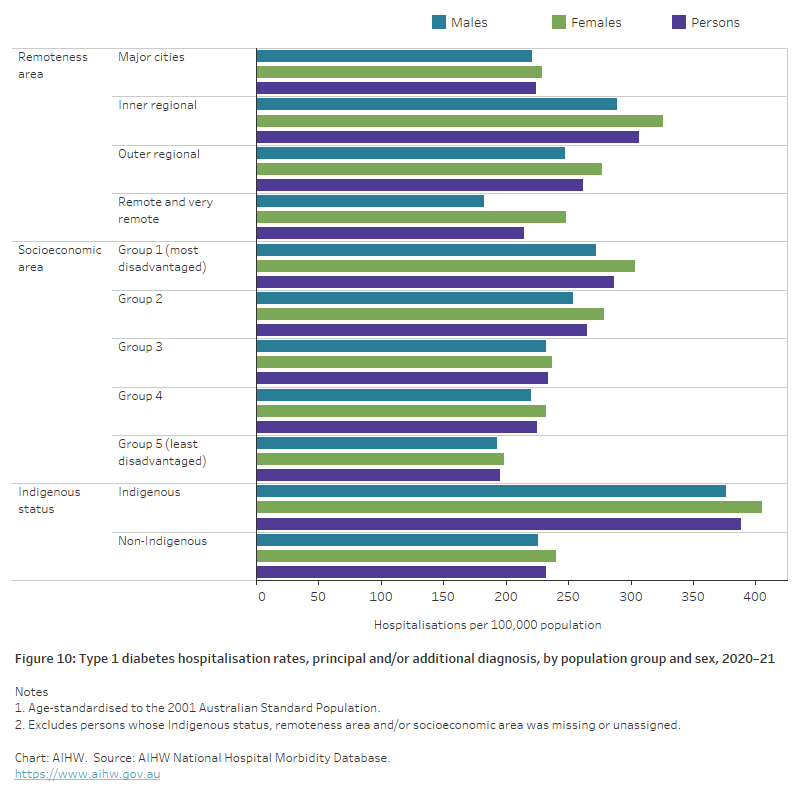
The chart shows hospitalisations with type 1 diabetes as the principal and/or additional diagnosis, by population group and sex for 2020–21. Rates among remoteness areas were highest in Inner regional areas with 307 per 100,000 population compared to 214 per 100,000 population in Remote and very remote areas. Age-standardised rates were 1.5 times as high among those living in the lowest socioeconomic areas as those living in the highest socioeconomic areas and 1.7 times higher among Indigenous as non-Indigenous Australians.
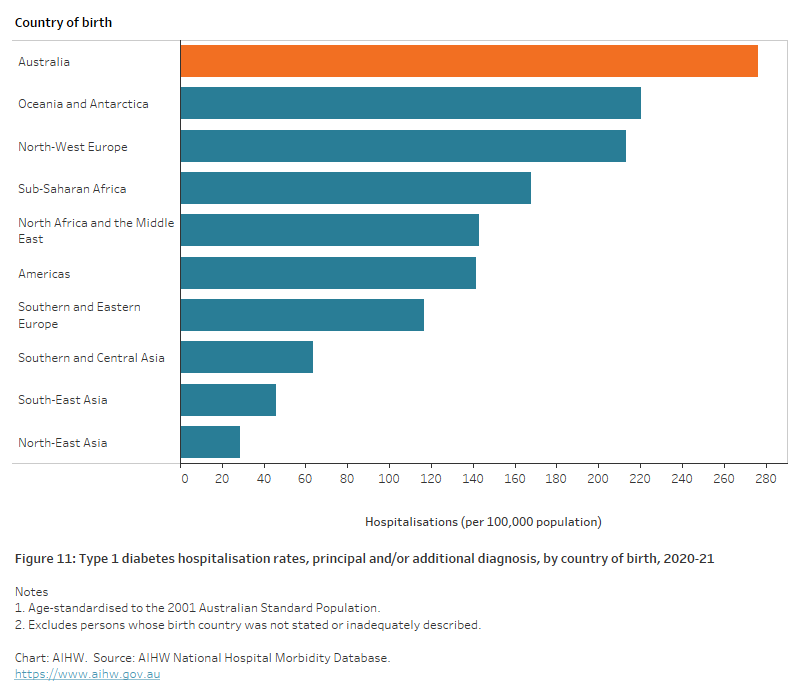
The chart shows the age-standardised hospitalisations for type 1 diabetes as the principal and/or additional diagnosis, by country of birth for 2020–21. Type 1 diabetes hospitalisation rates were highest among people born in Australia (276 per 100,000 population) and lowest among those born in North-East Asia (29 per 100,000 population).
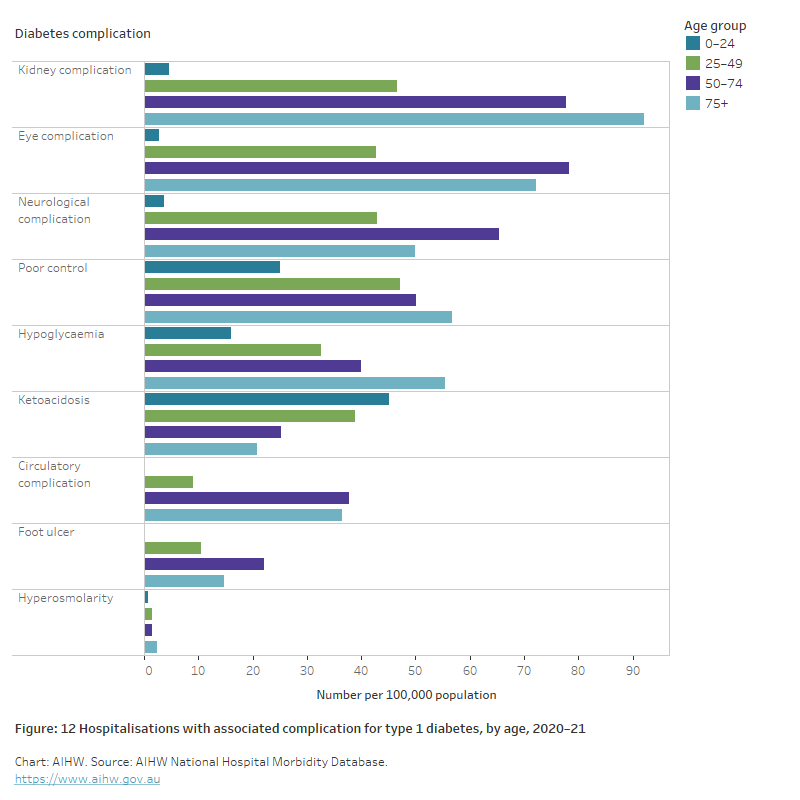
The bar chart shows hospitalisations with associated diabetes complications for type 1 diabetes, by age group for 2020–21. The most common complication associated with hospitalisations for type 1 diabetes were kidney and eye complications. The rate of kidney complications peaked among those aged 75+ at 92 per 100,00 population and eye complications peaked among people aged 50–74 with 78 per 100,000 population. The only complication where rates reduced with increasing age was ketoacidosis which peaked among people aged 0–24 at 45 per 100,000 population.
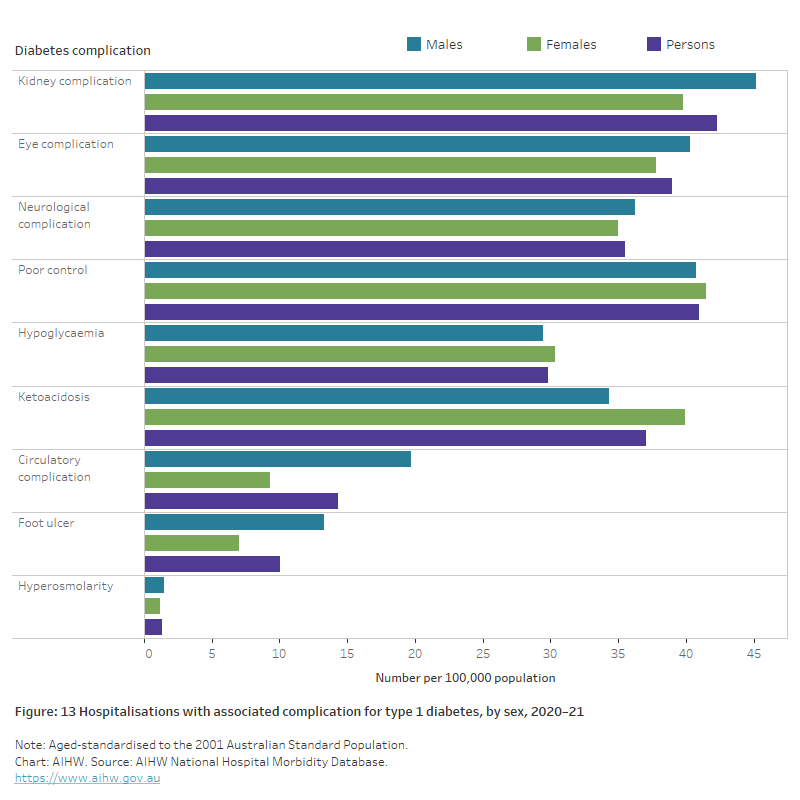
The bar chart shows hospitalisations with associated diabetes complications for type 1 diabetes, by sex for 2020–21. Males were more likely than females to have hospitalisations associated with type 1 diabetes complications including foot ulcer, kidney, eye, neurological and circulatory complications. Ketoacidosis was the only complication where rates were notably higher among females than males (1.2 times higher).
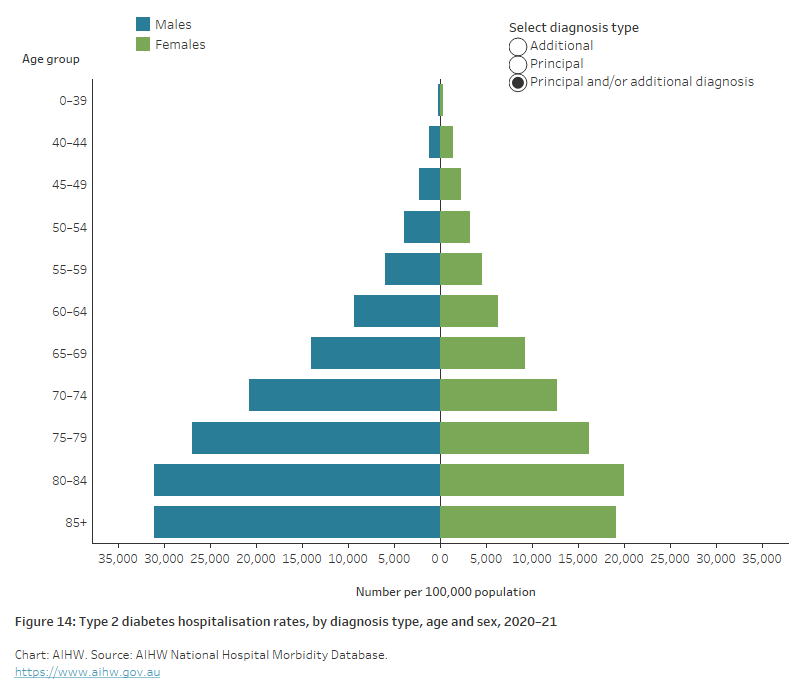
The bar chart shows hospitalisations with type 2 diabetes as the principal and/or additional diagnosis peaked in the 80–84 age group with 31,069 and 20,030 hospitalisations for males and females, respectively, per 100,000 population. Hospitalisations with type 2 diabetes as a principal diagnosis were around twice as high among males as females peaking the 80–84 age group with 1,106 and 534 hospitalisations per 100,000 for males and females, respectively.
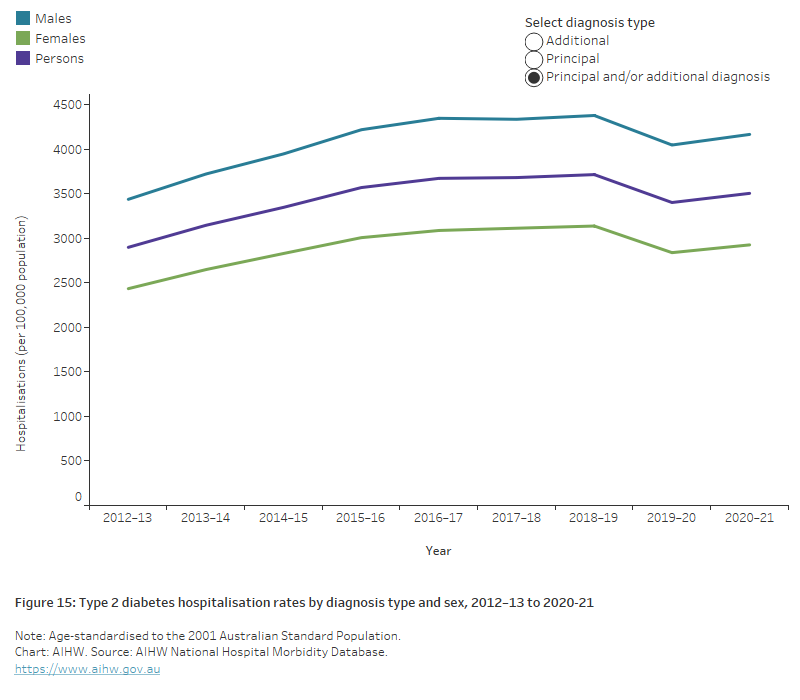
The chart shows the rate of hospitalisations with type 2 diabetes as the principal and/or additional diagnosis increased 21% overall between 2012-13 to 2020–21, for both males and females. A slight dip in rates in 2019–20 was followed by an increase again in 2020–21. Throughout this period, rates have remained around 1.4 times higher among males than females.
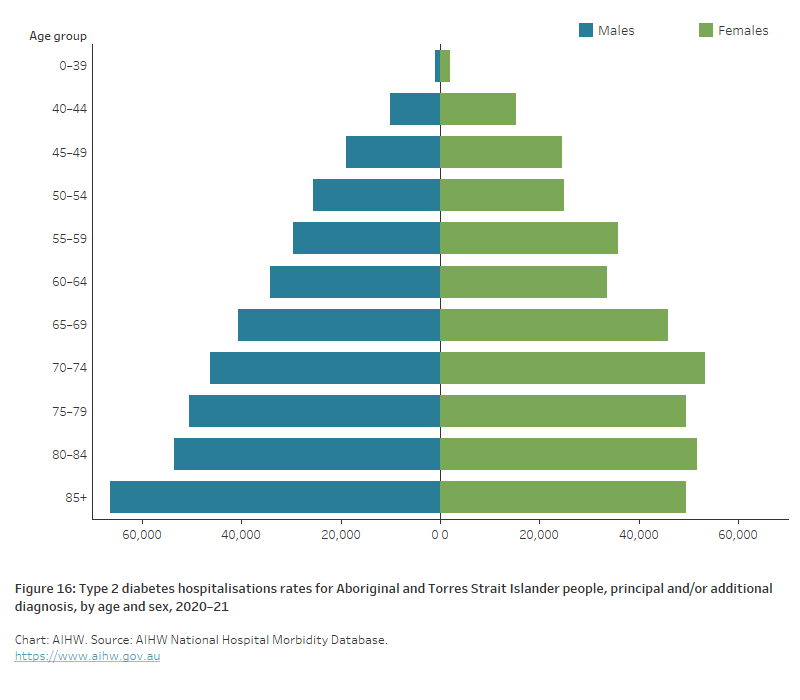
The bar chart shows hospitalisations with type 2 diabetes as the principal and/or additional diagnosis for Aboriginal and Torres Strait Islander people, by sex for 2020–21. Rates peaked for males in the 85+ year age group with 66,402 hospitalisations per 100,000 population and for females in the 70–74-year age group with 53,316 hospitalisations per 100,000 population.
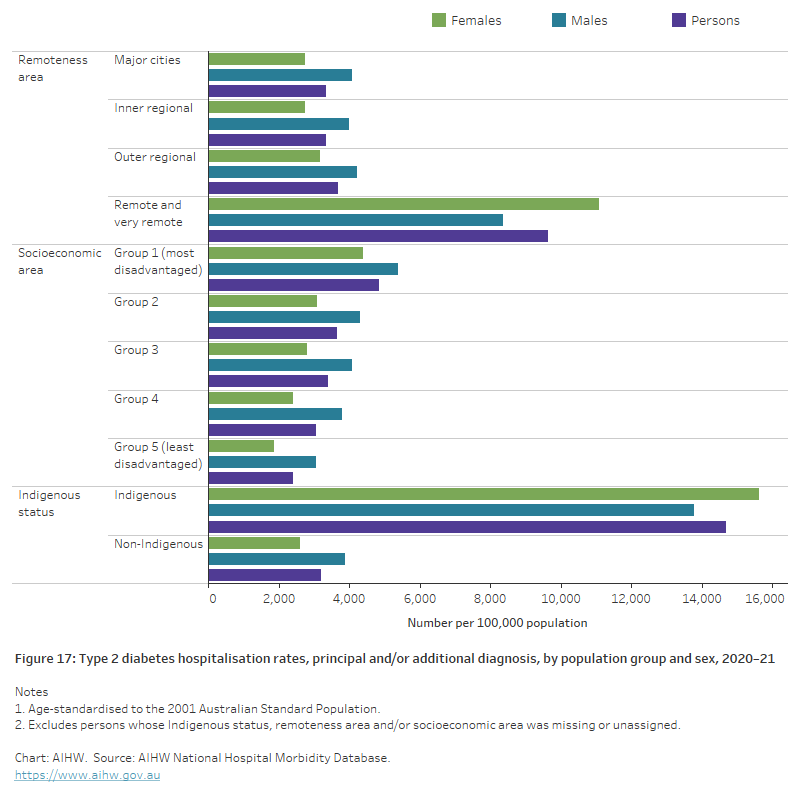
The bar chart shows the age-standardised hospitalisation rate with type 2 diabetes as the principal and/or additional diagnosis, by population group and sex for 2020–21. Rates increased with increasing remoteness and were 2.9 times higher among those living in Remote and very remote areas compared with those living in Major cities. Type 2 diabetes hospitalisation rates increased with increased socioeconomic disadvantage being 2.0 times higher among those living in the most disadvantaged areas compared with those living in the least disadvantaged areas. Type 2 diabetes hospitalisation rates among Indigenous Australians were 4.6 times higher than for non-Indigenous Australians.
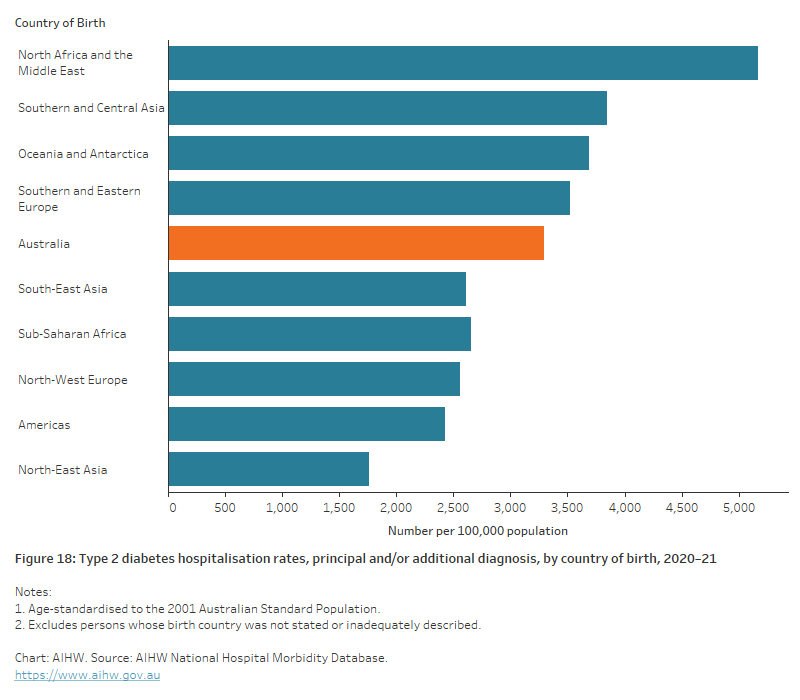
The chart shows the age-standardised hospitalisation rate for type 2 diabetes as the principal and/or additional diagnosis, by country of birth for 2020–21. Type 2 diabetes hospitalisation rates for people born in Northern Africa and the Middle East were 1.6 times as high compared with those born in Australia.
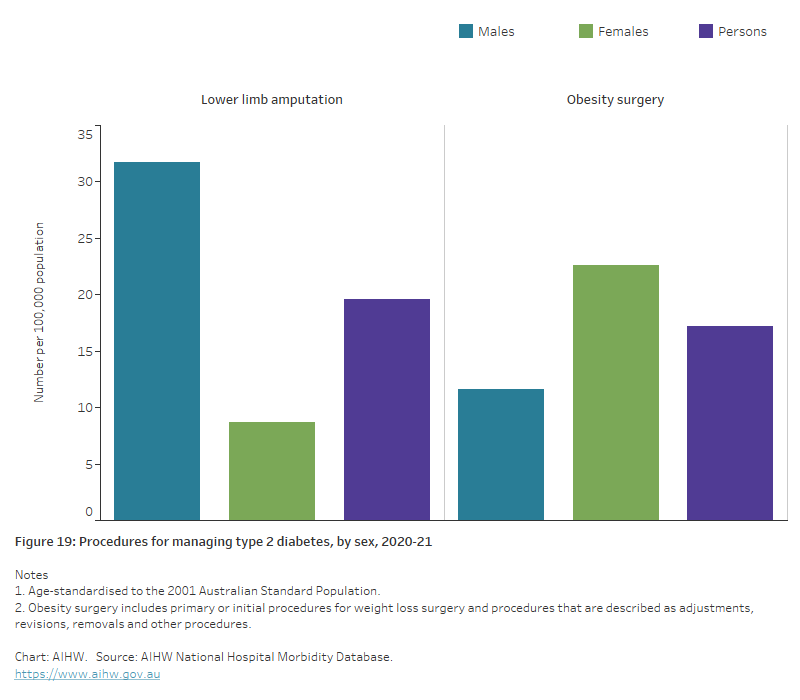
The bar chart shows age-standardised rates of procedures for managing type 2 diabetes, by sex for 2020–21. Rates for lower limb amputation were higher for males than females with 32 and 9 hospitalisations respectively, per 100,000 population. Hospitalisations for obesity surgery were higher among females than males with 23 and 12 hospitalisations per 100,000, respectively.
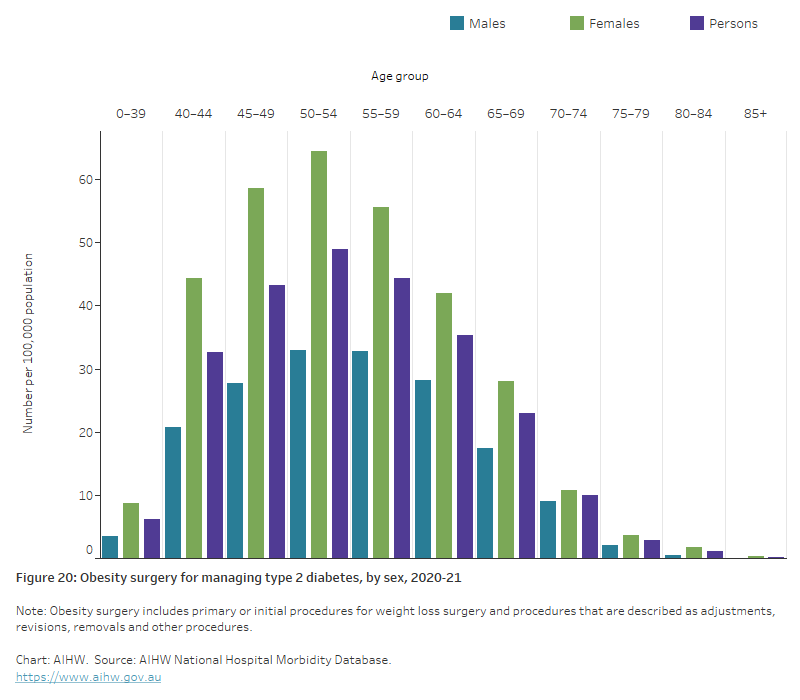
The chart shows rates of obesity surgery for managing type 2 diabetes, by sex and age for 2020–21. Rates peaked for both males and females in the 50–54-year age group with 33 and 64 procedures for males and females, respectively, per 100,000 population.
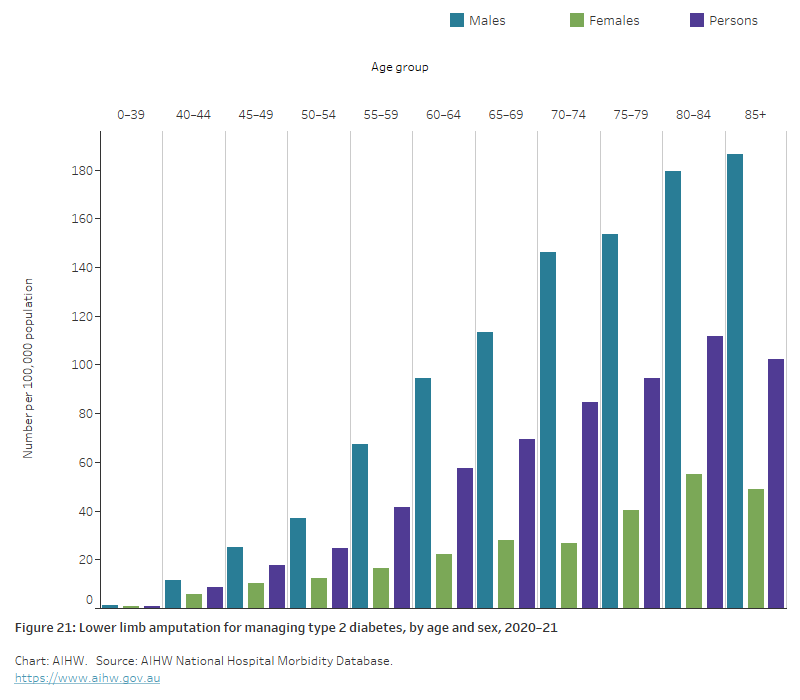
The chart shows rates of lower limb amputations for managing type 2 diabetes, by sex and age for 2020–21. Rates peaked among males in the 85 and over age group and females in the 80–84 age group with 187 and 55 procedures for males and females, respectively, per 100,000 population.
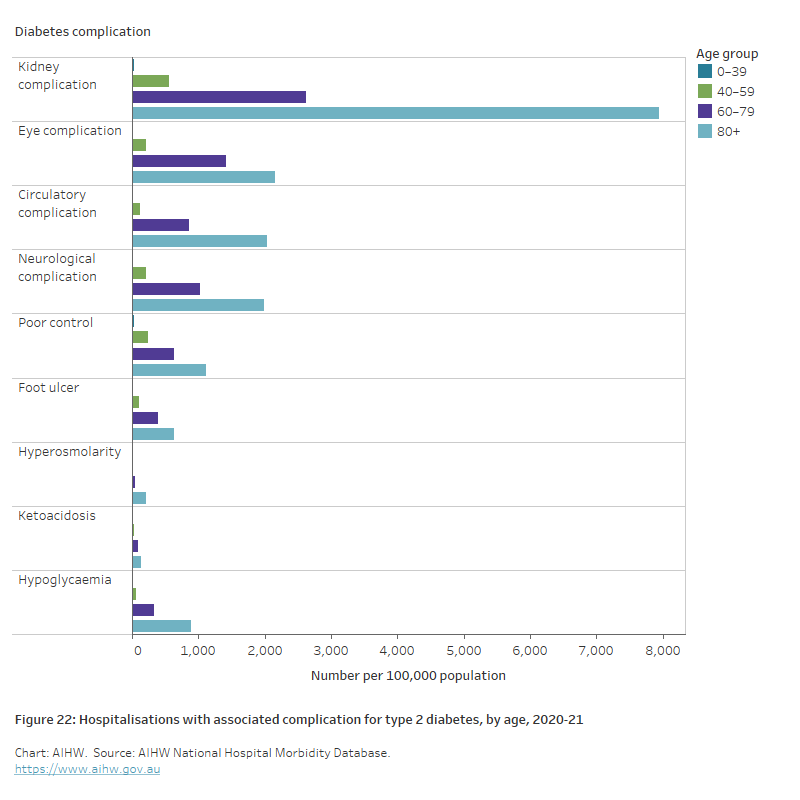
The chart shows hospitalisations for type 2 diabetes with associated diabetes complications, by age for 2020–21. Type 2 diabetes hospitalisation rates were highest in the 80+ age group across all complications with kidney complications having the highest rate at 7,941 hospitalisations per 100,000 population.
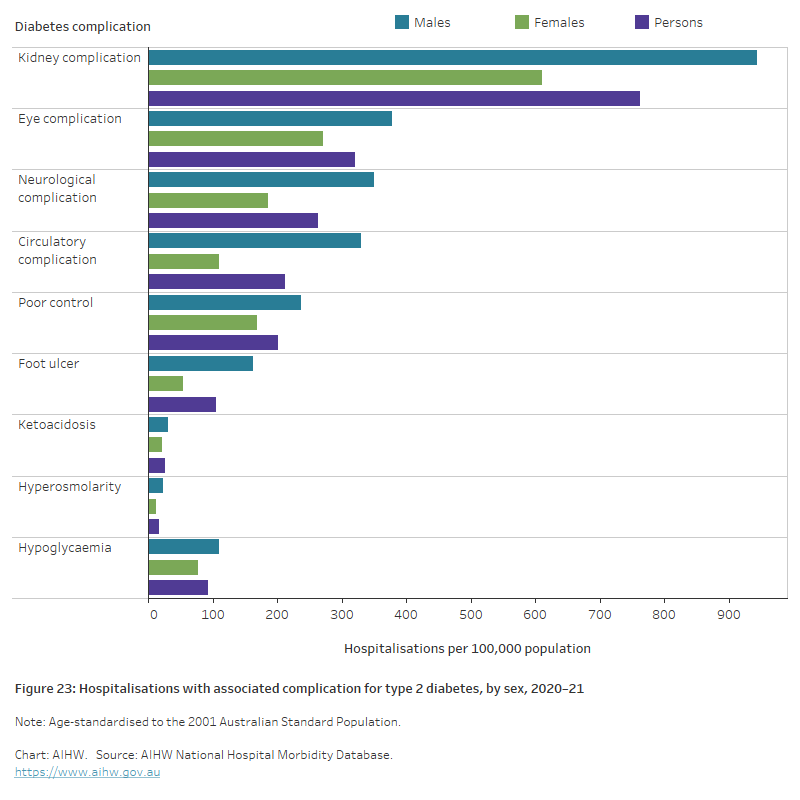
The chart shows age-standardised hospitalisation rates for type 2 diabetes with associated diabetes complications, by sex for 2020–21. Type 2 diabetes hospitalisation rates were highest for males across all complications with Kidney complications having the highest rate for both males and females with 943 and 611 hospitalisations for males and females, respectively, per 100,000 population.