Disability discrimination
Discrimination complaints
46% of complaints received by the Australian Human Rights Commission in 2022–23 were about disability discrimination.
Experience of discrimination
In 2018, 1 in 6 (16%) people aged 15–64 with disability said they have experienced disability discrimination in the previous year.
Avoiding situations
In 2018, 4 in 9 (44%) people aged 15–64 with disability said they had avoided situations in the previous year because of their disability.
On this page:
Introduction
Discrimination happens when a person, or group of people, is treated less favourably than others because of their background or personal characteristics.
Experiencing discrimination makes participating in everyday life more difficult. It can affect education and employment opportunities and limit social interactions. A person unable to participate in everyday activities, or who avoids situations, may be at higher risk of adverse outcomes, including social isolation, unemployment and poor health.
What is disability discrimination?
Disability discrimination occurs when a person with disability is treated unequally, less favourably, or not given the same opportunities as other people because of their disability. The treatment may be direct or indirect.
Direct discrimination involves overt acts, often intentional, such as explicitly denying rights under the law or deliberately excluding people with disability from community life. For example, refusing a person entry to a café because they have a guide dog.
Indirect discrimination involves passive or unthinking acts. It can be unintentional or accidental. It occurs when a practice, policy or rule that applies to everyone causes unreasonable disadvantage to a person with disability. For example, if the only way to enter a public building is by a set of stairs, this indirectly discriminates against people with disability who use wheelchairs (AHRC 2012).
What is the law?
The Disability Discrimination Act 1992 (Cwlth) makes it against the law to treat people unfairly because of their disability.
In 2019, an estimated 1 in 5 (22%) people aged 15 and over with disability experienced some form of discrimination (including disability discrimination), compared with 1 in 7 (15%) people without disability (ABS 2020).
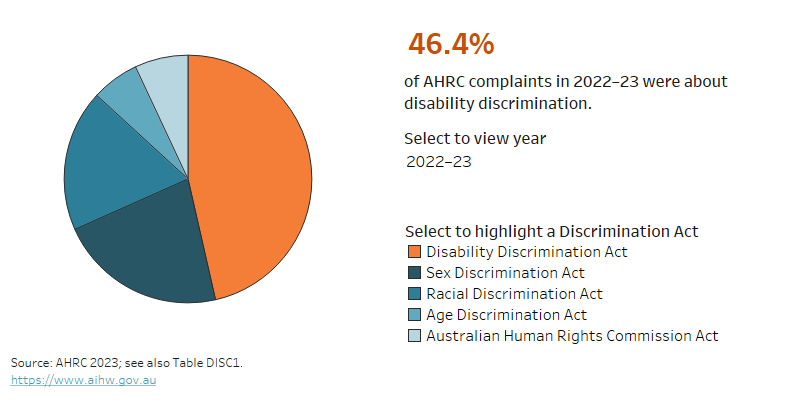
Disability discrimination complaints are consistently the largest category of complaints reported to the Australian Human Rights Commission (AHRC) (Figure DISCRIMINATION.1).
Figure DISCRIMINATION.1: Discrimination complaints received by the Australian Human Rights Commission (AHRC), by Act, 2013–14 to 2022–23
The chart shows that complaints about disability discrimination are the most common received by the Australian Human Rights Commission (46% in 2022–23).
Source data tables: Data tables – Disability discrimination. View data tables
Australian Human Rights Commission complaints data
Complaints data in this section are sourced from the Australian Human Rights Commission (AHRC). AHRC is an independent statutory organisation set up to protect and promote human rights in Australia and internationally.
People who experience discrimination can complain to the AHRC. Each year, the commission compiles data on these complaints and publishes complaint statistics as part of its annual reporting. A complaint may raise several grounds and areas of discrimination and can be against one or more respondents.
Australia's Disability Strategy reporting
Resolution of complaints related to disability discrimination is one of the measures reported under the Australia's Disability Strategy Outcomes Framework. For more information, including trends and comparisons by population groups, please see Discrimination complaints resolved on Reporting on Australia's Disability Strategy 2021–2031 website.
Data note
Data on this page are largely sourced from the Australian Bureau of Statistics’ (ABS) 2018 Survey of Disability, Ageing and Carers (SDAC). For more information about the SDAC, including the concepts of disability, disability severity, disability groups, and remoteness categories used by the SDAC, see ‘Data sources’.
Unless otherwise indicated, all data on this page refer to 2018.
SDAC discrimination module
The SDAC defines disability discrimination as people being unfairly considered or treated because of their disability.
The discrimination data are collected for people with disability aged 15 and over living in households who had a personal interview. Unlike other modules in the SDAC, the discrimination module does not allow response by a proxy. A proxy is a person aged 15 or over who answers the survey questions on behalf of someone who has been selected for interview. A proxy interview may be conducted:
- when the selected person is under 15 years of age
- when the selected person is aged 15–17 and parental consent to interview them personally has not been provided
- due to the selected person's illness, injury or language difficulties (ABS 2019b).
Because no proxy interviews are used in its collection, the discrimination data collected as part of the SDAC may underestimate the proportion of people with disability who experience discrimination.
Experience of discrimination
In 2018, about one in 10 (9.6% or 314,000) people with disability aged 15 and over (and living in households) have reported experiencing discrimination due to disability in the last 12 months (ABS 2019b). This was higher for:
- people aged 15–64: 1 in 6 (16% or 264,000) people aged 15–64 with disability experienced disability discrimination, compared with 3.2% (or 51,000) of those aged 65 and over
- people with severe or profound disability: 1 in 3 (32% or 105,000) people aged 15–64 with severe or profound disability experienced disability discrimination, compared with 12% (or 160,000) of other people with disability in this age group
- people living in Inner regional or Outer regional and remote areas: 19% (or 79,000) of people aged 15–64 with disability living in Inner regional areas and 19% (or 32,000) in Outer regional and remote areas experienced disability discrimination, compared with 14% (or 154,000) in Major cities
- people with psychosocial or intellectual disability: 29% (or 134,000) of people aged 15–64 with psychosocial disability and 27% (or 53,000) of those with intellectual disability experienced disability discrimination in the previous year, compared with 17% (or 57,000) of those with sensory and speech disability and 17% (or 189,000) of those with physical disability (ABS 2019a).
People with psychosocial disability also account for the highest proportion of disability discrimination complaints the AHRC receives. Of 1,190 complaints received in 2022–23 (a complainant may have more than one type of disability):
- 33% of complaints were by people with mental health/psychosocial disability
- 25% by people with physical disability
- 24% by people with neurological disability (AHRC 2023).
Australia's Disability Strategy reporting
Freedom from discrimination is one of the measures reported under the Australia's Disability Strategy Outcomes Framework. For more information, including trends and comparisons by population groups, please see Freedom from discrimination on Reporting on Australia's Disability Strategy 2021–2031 website.
Sources of discrimination
People with disability may experience discrimination from various sources. Experiencing discrimination in one area of life can result in people avoiding that particular situation as well as avoiding other situations.
Of the estimated 264,000 people aged 15–64 with disability, living in households, who experienced disability discrimination in the previous year:
- 1 in 4 (24%) said it was by an employer
- 1 in 3 (32%) said it was by a person who provided goods or services (for example, health staff, bus and taxi drivers, hospitality staff, or sales assistants) – the biggest contribution being from health staff (22% of all people who experienced disability discrimination)
- 2 in 11 (18%) said it was by work colleagues (Table DISCRIMINATION.1).
Of 1,190 disability discrimination complaints the AHRC received in 2022–23 (noting that one complaint may relate to more than one area):
- half (50%) related to goods, services and facilities
- 1 in 3 (34%) to employment
- 1 in 7 (14%) each related to disability standards or education
- 1 in 12 (8.7%) related to access to premises (AHRC 2023).
Source of discrimination | Severe or profound disability | Other disability status | All with disability |
|---|---|---|---|
Employer | 16.9 | 29.5 | 24.4 |
Work colleagues | 13.1 | 20.1 | 18.1 |
Family or friends | 20.8 | 22.2 | 22.0 |
Providers of goods or services | 41.2 | 26.1 | 32.2 |
Strangers in the street | 20.6 | 15.5 | 17.4 |
Other sources | 29.5 | 26.5 | 28.7 |
Notes:
- Data are for people aged 15–64 with disability living in households who had a personal interview and experienced disability discrimination.
- More than one source of disability discrimination may be reported.
- ‘Providers of goods and services include health staff (GP, nurse, hospital staff), bus drivers/rail staff/taxi drivers, restaurant/hospitality staff, and sales assistants.
- ‘Other sources’ include teacher or lecturer, and other.
Source: ABS 2019a. See also Table DISC7, Data tables – Disability discrimination. View data tables
Discrimination and social participation
Discrimination directly affects a person’s participation and inclusion in everyday activities. It can also lead to people avoiding everyday activities, such as going to school or work, attending events or seeking medical help. This, in turn, increases the risk that people with disability will experience social isolation, which can affect their overall health and wellbeing.
Almost a third (31% or 730,000) people aged 5–64 with disability, living in households, do not leave home as often as they would like to. The most common main reasons for this are own disability or condition (53% or 384,000), fear or anxiety (13% or 98,000) and cost or inability to afford (9.2% or 67,000) (ABS 2019a).
What is social isolation?
Social isolation is where a person has minimal contact with others. It differs from loneliness, which is a negative feeling or emotion a person has about having less social contact or connection than desired.
See ‘Social inclusion and community support’ section in this report for more information on participation in society and social isolation for people with disability.
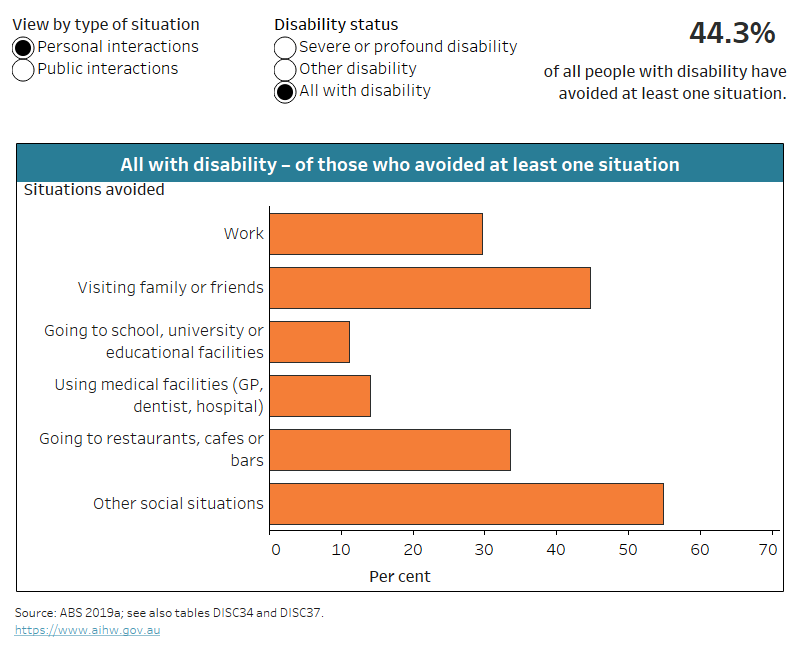
Avoiding situations
About 4 in 9 (44% or 751,000) people aged 15–64 with disability, living in households, avoided situations in the previous year because of their disability. Of those who avoided one or more situations because of their disability:
- 45% avoided visiting family or friends
- 37% avoided going to shops and banks
- 34% avoided going to restaurants, cafés or bars
- 30% avoided work
- 24% avoided using public transport
- 20% avoided using public parks or recreation venues (Figure DISCRIMINATION.2).
What is meant by situations?
In this section ‘situations’ refer to work and study, service, hospitality and retail venues, social situations, public transport, and public places.
Figure DISCRIMINATION.2: Situations avoided by people with disability aged 15–64, by disability severity, 2018
The chart shows that one of the most avoided situations was visiting family and friends (45% of people with disability who avoided situations).
Notes:
- Data are for people with disability aged 15–64 living in households who had a personal interview.
- ‘Avoided situations’ refers to situations the person avoided in the last 12 months because of their disability.
Source data tables: Data tables – Disability discrimination. View data tables
Large differences in proportions of people avoiding situations because of disability occur between people with severe or profound disability and other people with disability, aged 15–64 living in households. More than two-thirds (68% or 222,000) of people with severe or profound disability avoided situations compared with around 2 in 5 (39% or 526,000) other people with disability. Of those who avoided at least one situation because of their disability, 40% (89,000) of people with severe or profound disability avoided public transport compared with 18% (93,000) of other people with disability (Figure DISCRIMINATION.2).
Differences in proportions of people avoiding situations because of disability also occur by disability group:
- nearly three-quarters (73% or 343,000) of people with psychosocial disability have avoided situations
- nearly 3 in 5 (58% or 73,000) people with head injury, stroke or acquired brain injury have avoided situations
- about 2 in 5 (41% or 134,000) people with sensory and speech disability have avoided situations (ABS 2019a).
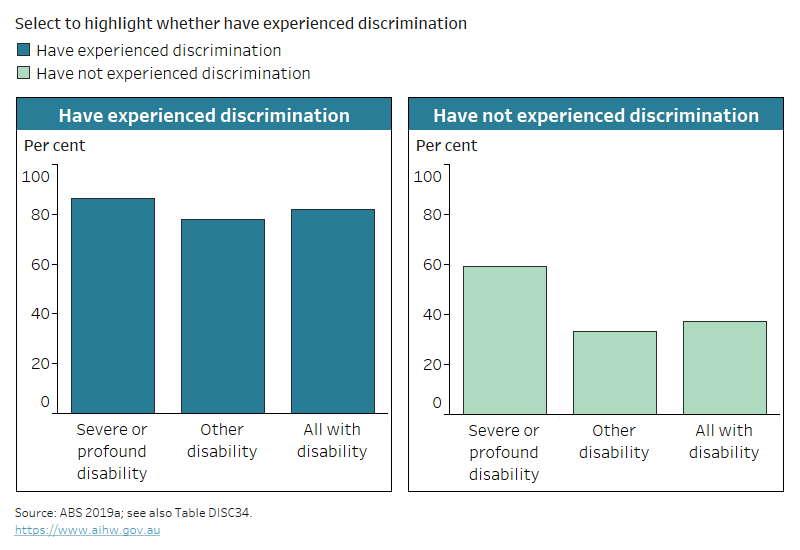
People with disability are even more likely to avoid situations because of their disability if they have experienced discrimination. More than 4 in 5 (82% or 216,000) people aged 15–64 who have experienced disability discrimination in the previous year also avoided situations because of their disability in that time (figure DISCRIMINATION.3). This compares with less than 2 in 5 (37% or 534,000 people) who have not experienced discrimination. People with severe or profound disability are also more likely to avoid situations if they have experienced discrimination (86%, compared with 59% of those who had not experienced discrimination).
Figure DISCRIMINATION.3: Proportions of people with disability aged 15–64 who avoided at least one situation, by experience of discrimination and severity of disability, 2018
The chart shows people with other disability who experienced discrimination are more likely to avoid situations (78%) than those who have not (33%).
Notes:
- Data are for people with disability aged 15–64 living in households who had a personal interview.
- ‘Avoided situations’ refers to situations the person avoided in the last 12 months because of their disability.
Source data tables: Data tables – Disability discrimination. View data tables
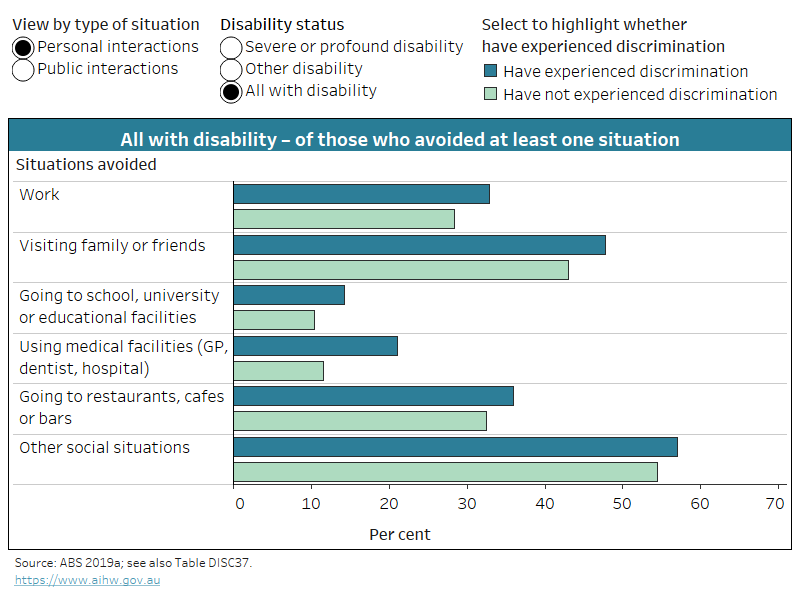
The types of situations avoided also vary (Figure DISCRIMINATION.4). People with disability who have experienced discrimination tend to be more likely to avoid each specific situation than those who have not experienced discrimination, especially using medical facilities (21% and 12%, respectively), and going to shops or banks (45% and 34%, respectively) (Figure DISCRIMINATION.4).
Figure DISCRIMINATION.4: Situations avoided by people with disability aged 15–64, by experience of discrimination and severity of disability, 2018
The chart shows that higher proportions of people who experienced discrimination had avoided situations, such as using public transport (29% and 22%).
Notes:
- Data are for people with disability aged 15–64 living in households who had a personal interview.
- ‘Avoided situations’ refers to situations the person avoided in the last 12 months because of their disability.
Source data tables: Data tables – Disability discrimination. View data tables
People with psychosocial disability are the most likely disability group to avoid situations because of their disability:
- almost 3 in 4 (73% or 343,000) people aged 15–64 with psychosocial disability, living in households, avoided situations in the previous year
- 58% (or 73,000) of those with head injury, stroke or acquired brain injury avoided situations
- 48% (or 92,000) of those with intellectual disability
- 46% (or 516,000) of those with physical restriction
- 41% (or 134,000) of those with sensory and speech disability (ABS 2019a).
Females (47% or 425,000) with disability, living in households, were more likely to avoid situations because of their disability in the previous year than males (41% or 325,000) (ABS 2019a).
Discrimination and education
People with disability are less likely to be engaged in education, particularly higher education, compared with people without disability (see ‘Education and skills’ for more information). This can be influenced by experiencing discrimination, including:
- being explicitly denied educational rights, such as attending school
- not having reasonable adjustments made to the educational environment or tasks to make it possible for them to participate equally, such as modifying equipment or assessment procedures.
In 2018, among people aged 15–64 with disability living in households, an estimated:
- 1 in 27 (3.7% or 9,700) of those who experienced disability discrimination in the previous year, have experienced disability discrimination from a teacher or lecturer
- 1 in 6 (17% or 30,100) of those attending a school or other educational institution experienced disability discrimination, inside or outside the education system
- 1 in 9 (11% or 84,000) of those who avoided situations because of disability, avoided going to school, university or an educational facility – about 3 in 8 (37% or 31,000) of these experienced disability discrimination in that time (ABS 2019a) (Table DISCRIMINATION.2).
Who does the SDAC discrimination module capture?
The discrimination module of the SDAC is collected for people with disability aged 15 and over living in households who had a personal interview. The high age cut-off of 15 and the necessity of it being a personal interview mean that the 2018 discrimination data refer to an estimated 182,000 students (ABS 2019a). These students may attend secondary school, university, TAFE or technical college, or other educations institutions such as business college and industry skills centres. See ‘Engagement in education’ for more details.
| Whether experienced discrimination | % | Estimate (‘000) |
|---|---|---|
Have experienced discrimination | 36.8 | 30.8 |
Have not experienced discrimination | 66.1 | 55.4 |
Total | 100.0 | 83.8 |
Notes:
- Data are for people aged 15–64 with disability living in households who had a personal interview and who had avoided an educational facility (including school, university or other facility) in the last 12 months because of their disability.
- Figures are rounded and components may not add to total because of ABS confidentiality and perturbation processes.
Source: ABS 2019a. See also Table DISC42, Data tables – Disability discrimination. View data tables
Other sources of information
Additional data about experience of discrimination and exclusion by children and young people with disability in education settings is provided by Children and Young People with Disability Australia (CYDA), a not-for-profit community organisation representing the rights and interests of Australian children and young people with disability (aged 0–25). During 2022 and 2023, CYDA conducted three surveys of children and young people with disability and their families and caregivers:
- Early Childhood Education & Care Survey 2022 – for families and caregivers of children in early childhood education and care settings (Dickinson et al. 2022)
- Youth Education Survey 2022–23 – for students with disability who are at school or who have recently left or finished school (Smith et al. 2023)
- School Education Survey 2022 – for families and caregivers of children and young people in school (Dickinson et al. 2023).
This box presents selected findings from the 2 school-related surveys. Due to the design of these surveys and small numbers of respondents (230 and 380, respectively), they are not considered representative, and the results should be used with caution.
While more than half of family and caregivers of school students with disability agreed that students (61%) and family and caregivers themselves (62%) were made to feel welcome at the school, they also talked about students with disability being excluded or bullied at school (Dickinson et a. 2023). Among family and caregiver respondents:
- 29% said their child has been excluded from excursions, events or activities
- 50% said their child experienced bullying from other children or staff
- only 28% agreed that teachers and support staff have education and training to support the student
- 15% said their child had been refused enrolment
- 19% experienced the hours of their child’s school attendance being limited (Dickinson et al. 2023).
Among the student respondents:
- 70% reported being excluded from events or activities at school
- 65% said they experienced bullying at school
- only 28% reported feeling supported to learn and experience activities at school (Smith et al. 2023).
Discrimination and employment
Compared with people without disability, people with disability generally have:
- lower rates of labour force participation
- lower rates of employment
- higher rates of unemployment
- greater reliance on government pensions or benefits as their main source of income than people without disability.
See ‘Employment’ and ‘Income support’ for more information.
Participation in employment and the ability to be financially independent can be affected by experiencing discrimination. This can include people with disability:
- being directly denied employment
- having employers fail to provide reasonable adjustments in the workplace to enable them to work safely and productively, such as providing safe access to the workplace or assistive technology.
People who have experienced discrimination because of their disability are less likely to be employed than those who have not. An estimated 1 in 3 (34% or 89,000) people with disability aged 15–64 who experienced discrimination in the previous year are employed, compared with 1 in 2 (53% or 755,000) who did not (ABS 2019a).
People with disability aged 15–64 who are unemployed (24% or 23,000) and those not in the labour force (20% or 151,000) are more likely to experience disability discrimination than people who are employed (11% or 89,000) (Table DISCRIMINATION.3, ABS 2019a).
Labour force status | Have experienced discrimination | Have not experienced discrimination | Total |
|---|---|---|---|
Employed | 10.5 | 89.3 | 100.0 |
Full-time | 9.0 | 90.7 | 100.0 |
Part-time | 13.0 | 87.7 | 100.0 |
Unemployed | 24.4 | 74.1 | 100.0 |
Not in the labour force | 20.0 | 80.1 | 100.0 |
Notes:
- Data are for people with disability aged 15–64 living in households who had a personal interview.
- Experience of discrimination refers to discrimination because of their disability in the last 12 months.
- ‘Not in the labour force’ refers to people who are not employed or unemployed. This includes people who undertake unpaid household duties or other voluntary work only, are retired, voluntarily inactive and those permanently unable to work.
- Figures are rounded and components may not add to total because of ABS confidentiality and perturbation processes. Due to these processes, figures may differ from those published by the ABS and across tables.
Source: ABS 2019a; see also Table DISC43, Data tables – Disability discrimination. View data tables
Of people aged 15–64 with disability who avoided situations in the previous year, an estimated 3 in 10 (30% or 223,000) avoided going to work (ABS 2019a). About 32% (or 71,000) of these experienced some form of disability discrimination in that time:
- 1 in 5 (17%) from an employer or work colleague
- 1 in 5 (19%) from another source (Table DISCRIMINATION.4).
Source of discrimination | % | Estimate |
|---|---|---|
Have experienced discrimination | 31.9 | 71.1 |
Employer or work colleague | 17.3 | 38.6 |
Other sources | 19.3 | 43.0 |
Have not experienced discrimination | 68.0 | 151.5 |
Total | 100.0 | 222.7 |
Notes:
- Data are for people with disability aged 15–64 living in households who had a personal interview and who avoided work because of their disability in the last 12 months.
- Experience of discrimination refers to discrimination because of their disability in the last 12 months.
- ‘Other sources’ include family or friends, teacher or lecturer, health staff (GP, nurse, hospital staff), bus drivers/rail staff/taxi drivers, restaurant/hospitality staff, sales assistants, strangers in the street, and other.
- A person may have experienced discrimination from more than one source, so components will not add to total. A person who experienced discrimination from more than one source is counted only once in aggregated totals.
Source: ABS 2019a. See also Table DISC44, Data tables – Disability discrimination. View data tables
People with disability aged 15–64 who experience disability discrimination from an employer or colleague are twice as likely to avoid work as those who experience disability discrimination from another source, and around 4 times as likely as those who did not experience disability discrimination. In 2018, of people aged 15–64 with disability, an estimated:
- 45% (or 39,000) who experienced disability discrimination the previous year from an employer or work colleague, avoided work
- 21% (or 43,000) who experienced disability discrimination from another source, avoided work
- 11% (or 151,000) who did not experience disability discrimination, avoided work (ABS 2019a).
People with disability aged 15–64 in the low- and mid-income groups are twice as likely to have experienced disability discrimination in the previous year as those with high income (18% of those in income deciles 1–7 with $1,150 or less personal weekly income, compared with 9.0% of those in income deciles 8–10 with more than $1,150 personal weekly income) (ABS 2019a).
Access to facilities and services
People with disability may also experience discrimination in terms of environmental or structural elements that limit their access to, and ability to participate in, the community. This is often indirect discrimination.
The physical environment, for example, can present a barrier to how some people with disability participate in community life. Public spaces, in particular, might have obstacles that make moving around the community and participating in everyday activities difficult. This includes accessing buildings or facilities, as well as services such as public transport.
Australia’s Disability Strategy reporting
Accessibility of buildings, facilities and services is included in the Australia’s Disability Strategy 2021–2031 and reported under its Outcomes Framework. The related measures fall across several outcome areas and are summarised in this box.
Inclusive homes and communities outcome area:
- The built and natural environment accessibility priority:
- Access to government buildings: Proportion of people with disability who have difficulty accessing government buildings (8.1% in 2018, for those aged 5 and over)
- Accessing buildings and facilities: Proportion of people with disability who had no difficulty accessing buildings or facilities in the last 12 months (69% in 2018, for those aged 5 and over)
- Transport system accessibility priority:
- Public transport usability: Proportion of people with disability who can used all forms of public transport with no difficulty (66% in 2018, for those aged 5 and over)
- Public transport compliance: Compliance with the Disability Standards for Accessible Public Transport (requires future data development).
Health and wellbeing outcome area:
- Prevention and early intervention priority:
- Medical facility accessibility: Proportion of people with disability with difficulty accessing medical facilities (GP, dentist, hospital) (14% in 2018, for those aged 5 and over).
Note: the numbers reported in this summary box and on the Reporting on Australia’s Disability Strategy 2021–2031 website may differ slightly from the numbers reported elsewhere in this report, due to different data sources, populations, and/or reporting periods.
About 663,000 people with disability, aged 15–64 living in households who leave home, had challenges with mobility or communication. Of these people, 3 in 10 (30% or 198,000) found it difficult to access buildings or facilities. Those with sensory and speech disability were most likely (42% or 62,000) to have difficulty accessing building or facilities compared with other disability groups (ABS 2019a).
Difficulties accessing buildings or facilities are often related to the design of a structure or its surrounds. For example, of people with disability aged 15–64 who found it difficult to access a building or facility in the previous year:
- around 2 in 3 (63% or 126,000 people) faced difficulty getting around the building, including with stairs, internal doors, corridor widths or obstructed walkways
- 4 in 9 (45% or 90,000 people) had difficulty with car parking facilities
- 4 in 10 (41% or 82,000 people) faced difficulty with approach areas, including ramps, handrails and lighting (ABS 2019a).
The types of building or facilities people with disability aged 15–64 most often had difficulty accessing in the previous year are:
- shops and banks (68% or 134,000 people)
- medical facilities (43% or 84,000 people)
- restaurants and cafés (34% or 67,000 people)
- government buildings (30% or 60,000 people) (ABS 2019a).
Some people with disability also find it difficult to use public transport. About 1 in 6 (16% or 326,000) people aged 15–64 with disability, living in households who leave home, have difficulty using some or all forms of public transport. This includes:
- using steps (34% or 111,000 people)
- facing fear or anxiety (32% or 104,000 people)
- getting to stops or stations (21% or 69,000 people)
- finding a seat or standing (20% or 65,000 people) (ABS 2019a).
A further 1 in 9 (11% or 221,000) people aged 15–64 with disability, living in households who leave home, are unable to use public transport at all. About 1% (or 21,000) of people aged 15–64 with disability living in households do not leave home (ABS 2019a).
Large differences in the proportions of people who find it difficult to use public transport occur between people with severe or profound disability (40% or 197,000) and other people with disability (8.4% or 129,000), aged 15–64 living in households who leave home. A further 27% (or 132,000) of people with severe or profound disability are unable to use public transport at all, compared with 1 in 17 (5.8% or 90,000) other people with disability (ABS 2019a).
This also differs by remoteness. Around 1 in 12 (8% or 108,000) people aged 15–64 with disability living in Major cities are unable to use public transport at all, compared with 1 in 7 (14% or 69,000) living in Inner regional areas and 1 in 4 (23% or 44,000) in Outer regional and remote areas (ABS 2019a).
By disability group, more than 1 in 5 (21% or 33,000) people with head injury, stroke or acquired brain injury are unable to use public transport at all, compared with about 1 in 8 (13% or 172,000) with physical disability (ABS 2019a).
Access to facilities and services for people with and without disability
When services are accessible, everyone has equal access to the services they wish to use. Inaccessible services can limit a person’s ability to receive the support they need, particularly for people with disability.
Data note
While the Survey of Disability, Ageing and Carers (SDAC) collects extensive information about ease of access to various facilities and services, this information is only collected for people with disability. Other sources of data need to be used to compare experiences of people with and without disability.
Data in this section are sourced from the Australian Bureau of Statistics’ (ABS) 2019 General Social Survey (GSS). For more information about GSS, see ‘Data sources’.
In 2019, people with disability aged 15 and over were less likely to have access to a motor vehicle to drive than people without disability (81% compared with 86%, respectively); the proportions for people with disability varied by age group – 83% of those aged 15–64 and 75% of those aged 65 and over (ABS 2021).
People with disability aged 15 and over were more likely to experience problems accessing service providers than people without disability (28% compared with 20%, respectively). The types of service providers where people with disability experience problems are:
- Centrelink/Family Assistance Office/Medicare (50%)
- telecommunication services (35%)
- hospitals and health-related services (29%)
- banks or financial institutions (28%)
- other services (15%) (ABS 2021).
Access to facilities and services for First Nations people with disability
Data note
Data in this section are sourced from the Australian Bureau of Statistics’ (ABS) 2014–15 National Aboriginal and Torres Strait Islander Social Survey (NATSISS). For more information about NATSISS, see ‘Data sources’.
Aboriginal and Torres Strait Islander (First Nations) people aged 15 and over with disability are more likely to have problems accessing services than those without disability (29% compared with 20% in 2014–15). Females with disability (32%) are more likely to have problems accessing services than males (26%) (ABS 2016).
For First Nations people with disability who have problems accessing services, the top 5 barriers to access are:
- waiting too long or appointment not available at time required (50%)
- poor customer service (38%)
- inadequate services in area (37%)
- no service in area (32%)
- transport or distance (28%) (ABS 2016).
The services First Nations people with disability have most problems accessing are:
- Centrelink (33%)
- dentists (25%)
- doctors (23%)
- hospitals (17%)
- housing services (15%) (ABS 2016).
Discrimination and health
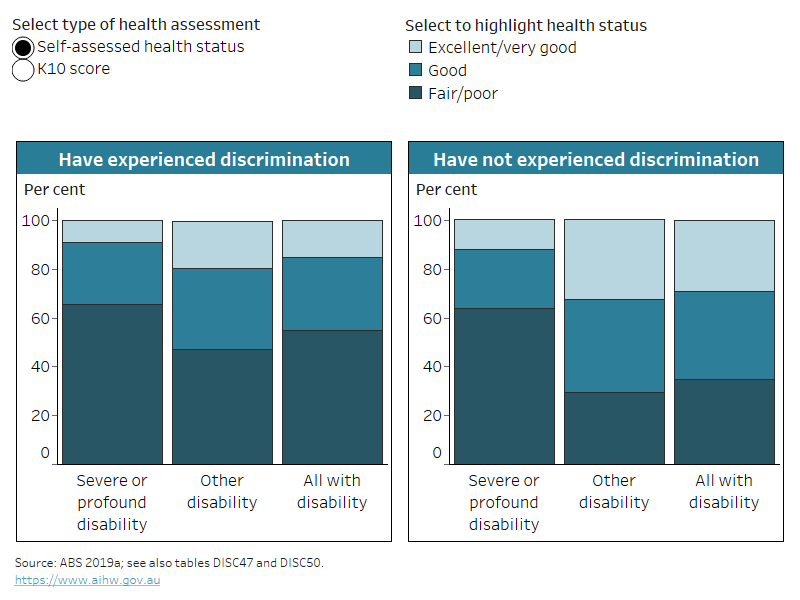
People with disability who experience disability discrimination are almost twice as likely as those who do not to report poorer health. In 2018, more than half (55% or 146,000) of people aged 15–64 with disability who had experienced disability discrimination in the previous year rated their health as fair or poor, compared with 1 in 3 (35% or 498,000) who had not (Figure DISCRIMINATION.5).
Self–assessed health status
Self-assessed health status is a commonly used measure of overall health in which a person is asked to compare their own health with others around them.
It reflects a person’s perception of their own health at a given point and provides a broad picture of a population’s overall health. It has some limitations, including being influenced by factors such as a person’s access to health services (for example, to diagnosis and treatment), and level of education.
In the ABS SDAC, self-assessed health status is collected for people aged 15 and over, with disability, living in households, who had a personal interview, against a 5-point scale from excellent to poor.
People with disability who experience disability discrimination are more than twice as likely as those who do not to have high or very high levels of psychological distress (Figure DISCRIMINATION.5). An estimated 71% (or 181,000) of people aged 18–64 with disability who experienced disability discrimination in the previous year have a high or very high level of psychological distress, compared with 37% (or 521,000) who did not (ABS 2019a).
Kessler Psychological Distress Scale (K10)
The Kessler Psychological Distress Scale (K10) is a survey device used to measure non-specific psychological distress in people. It uses a set of 10 questions about negative emotional states that participants in the survey may have experienced in the 4 weeks leading up to their interview. Higher levels of psychological distress indicate that a person may have, or is at risk of developing, mental health issues.
The ABS SDAC collects K10 information for people with disability aged 18 and over who have a personal interview.
Figure DISCRIMINATION.5 Health status of people with disability aged 15–64, by type of health assessment, whether have experienced discrimination, and disability severity, 2018
The chart shows that self-assessed health is worse and psychological distress level is higher for people who experienced disability discrimination.
Notes:
* Relative standard error of 25–50% and should be used with caution.
- Data are for people with disability aged 15–64 living in households who had a personal interview. Self-assessed health status is collected for people aged 15 and over, K10 score is collected for people aged 18 and over.
- ‘Experience of discrimination’ refers to discrimination because of their disability in the last 12 months.
- Figures are rounded and components may not add to total because of ABS confidentiality and perturbation processes.
Source data tables: Data tables – Disability discrimination. View data tables
Experiencing discrimination may also result in people with disability avoiding medical facilities. An estimated 1 in 7 (14% or 105,000) aged 15–64 with disability, who avoided situations due to their disability, avoided medical facilities in the previous year. About 4 in 9 (43% or 46,000) of this group experienced disability discrimination in that time:
- 1 in 7 (14%) from health staff
- 1 in 3 (32%) from other sources (Table DISCRIMINATION.5).
| Source of discrimination
| % | Estimate |
|---|---|---|
Have experienced discrimination | 43.2 | 45.5 |
From health staff (GP, nurse, hospital staff) | 14.2 | 14.9 |
From other sources | 32.4 | 34.1 |
Have not experienced discrimination | 58.5 | 61.6 |
Total | 100.0 | 105.3 |
Notes:
- Data are for people with disability aged 15–64 living in households who had a personal interview and who avoided medical facilities (including GP, dentist, or hospital) in the last 12 months because of their disability.
- ‘Other sources’ of discrimination include employer, work colleagues, family or friends, teacher or lecturer, bus drivers/rail staff/taxi drivers, restaurant/hospitality staff, sales assistants, strangers in the street, and other.
- A person may have experienced discrimination from more than one source, so components will not add to total. A person who experienced discrimination from more than one source is counted only once in aggregated total.
Source: ABS 2019a. See also Table DISC53, Data tables – Disability discrimination. View data tables
People with disability aged 15–64 who experience disability discrimination from health staff are more likely to avoid medical facilities than those who experience disability discrimination from another source and around 6 times as likely as those who did not experience disability discrimination. In the previous year, an estimated:
- 25% (or 15,000) of people aged 15–64 with disability who experienced disability discrimination from health staff avoided medical facilities
- 15% (or 34,000) who experienced disability discrimination from another source avoided medical facilities
- 4.3% (or 62,000) who did not experience disability discrimination avoided medical facilities in that time (ABS 2019a).
Where can I find out more?
- Data tables for this report.
- ABS Disability, Ageing and Carers, Australia: Summary of Findings, 2018.
- Complaints to the AHRC, and the Disability Discrimination Act – AHRC website; a copy of the Act can be found in the Federal Register of Legislation.
- ABS General Social Survey (GSS) includes information on a broader experience of discrimination (that is, not only disability discrimination) for people with and without disability (based on the ABS Short Disability Module).
ABS (Australian Bureau of Statistics) (2016) Microdata: National Aboriginal and Torres Strait Islander Social Survey, 2014–15, ABS cat. no. 4720.0.55.002, ABS, AIHW analysis of TableBuilder data, accessed 12 January 2021.
ABS (2019a) Microdata: Disability, ageing and carers, Australia, 2018, ABS cat. no. 4430.0.30.002, ABS, AIHW analysis of TableBuilder data, accessed 5 August 2021.
ABS (2019b) Disability, ageing and carers, Australia: summary of findings, 2018, ABS, accessed 30 July 2021.
ABS (2020) General Social Survey: summary results, Australia, 2019, ABS, accessed 30 July 2021.
ABS (2021) General Social Survey, Australia, 2019 [data set], ABS, AIHW customised data request, accessed 2 June 2021.
AHRC (Australian Human Rights Commission) (2012) Know your rights: Disability discrimination, AHRC website, accessed 12 May 2022.
AHRC (2023) Australian Human Rights Commission 2022–23 complaint statistics, AHRC, AIHW analysis of published AHRC data, accessed 8 December 2023.
Dickinson H, Smith C, Yates S and Faulkner A (2022) Taking the first step in an inclusive life – experiences of Australian early childhood education and care, report prepared for Children and Young People with Disability Australia (CYDA), Melbourne, accessed 10 November 2023.
Dickinson, H, Smith, C, Yates, S and Faulkner A (2023) How deep does it go? Australian students with disability and their experience of entrenched inequity in education, CYDA School Education Survey 2022, report prepared for Children and Young People with Disability Australia (CYDA), Melbourne, accessed 10 November 2023.
Smith C, Dickinson H and Faulkner A (2023) “I think the teachers need more help” – Voices of experience from students with disability in Australia, CYDA Youth Education Survey 2022, Young People with Disability Australia (CYDA), Melbourne, accessed 10 November 2023.