Prevalence of disability
Disability prevalence
In 2018, an estimated 1 in 6 (18%) people in Australia had disability (about 4.4 million people).
Severe or profound disability
In 2018, 1 in 3 (32%) people with disability had severe or profound disability (about 1.4 million).
Main health condition
In 2018, for 1 in 4 (23%) people with disability, their main health condition was mental or behavioural.
On this page:
Introduction
Around 1 in 6 (18%) people in Australia – or about 4.4 million – have disability. This is also known as ‘disability prevalence’. Another 22% (or 5.5 million) of people in Australia have a long-term health condition but no disability, and the remaining 60% (or 14.8 million) have no disability or long-term health condition (ABS 2019a).
What is disability prevalence?
Disability prevalence is the number or proportion of the population living with disability at a given time.
Prevalence rates can be age-specific (for a particular age group) or age-standardised (controlling for age, so that populations with different age profiles can be compared).
In this report we provide age-specific data on people with disability. This approach was selected to better allow comparison of people with and without disability.
What affects prevalence?
Factors including changes to population survival rates (such as increased or decreased life expectancy), as well as survival rates for specific health conditions, can affect disability prevalence. It can also be affected by the age at which a health condition first occurs, and remission and rehabilitation rates.
The rate estimated by the national Australian Bureau of Statistics' (ABS) Survey of Disability, Ageing and Carers (SDAC) can vary, even when the actual prevalence might not, because of changes in social attitudes, government policy and survey methods.
Why is understanding prevalence important?
Knowing how many people are affected by disability, and their characteristics, informs planning for providing services and building inclusive communities through practices and policies enabling people with disability to participate fully in society.
Data note
Data on this page are largely sourced from the Australian Bureau of Statistics' (ABS) 2018 Survey of Disability, Ageing and Carers (SDAC). For more information about the SDAC, including the concepts of disability, disability severity, disability groups, and remoteness categories used by the SDAC, see ‘Data sources’.
Nearly one-third (32%) of people with disability – about 1.4 million or 5.7% of the Australian population – have severe or profound disability. This means sometimes or always needing help with daily self-care, mobility or communication activities, having difficulty understanding or being understood by family or friends, or communicating more easily using sign language or other non-spoken forms of communication (ABS 2019a).
While the number of people with disability has risen (from about 4.0 million in 2003), the prevalence rate has decreased over this period (from 20.0% in 2003 to 17.7% in 2018, or from an age-standardised rate of 19.8% in 2003 to 16.1% in 2018) (ABS 2019a). This indicates that the increase in the number of people with disability has been slower than the increase in the total population.
Sex and age
The prevalence of disability generally increases with age (Figure PREVALENCE.1). This means the longer people live, the more likely they are to experience some form of disability:
- 7.6% of children aged 0–14 have disability
- 9.3% of people aged 15–24 have disability
- 13% of people aged 15–64 have disability
- 50% of people aged 65 and over have disability (ABS 2019b).
The disability-free life expectancy of people in Australia (that is, the estimated years the average person can expect to live without disability) is increasing over time (see ‘Disability-free life expectancy’ for more information).
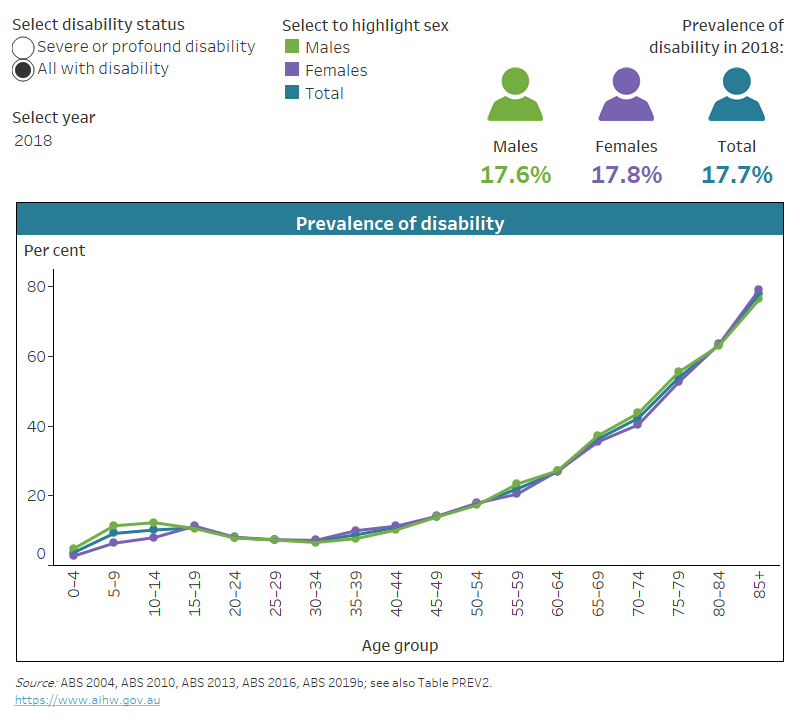
Figure PREVALENCE.1: Prevalence of disability, by disability status, age group and sex, 2003, 2009, 2012, 2015 and 2018
The chart shows the prevalence of disability rises with age (from less than 5% at 0–4 years in 2018, to 14% for 45–49, and 78% at 85 years and over).
Source data tables: Data tables – Prevalence of disability. View data tables
Overall, the likelihood of experiencing disability does not vary much by sex after childhood (Figure PREVALENCE.1):
- before the age of 15, boys are more likely to have disability than girls (9.5% of males and 5.7% of females aged 0–14 have disability)
- 9.2% of males and 9.5% of females aged 15–24 have disability
- 13% of males and females aged 15–64 have disability
- 49% of males and 50% of females aged 65 and over have disability (ABS 2019b).
Boys aged under 15 are also more likely than girls to have severe or profound disability; however, women aged 65 and over are more likely to have severe or profound disability than men (Figure PREVALENCE.1):
- 6.0% of males and 3.0% of females aged 0–14 have severe or profound disability
- 3.6% of males and 3.3% of females aged 15–24 have severe or profound disability
- 3.2% of males and females aged 15–64 have severe or profound disability
- 15% of males and 20% of females aged 65 and over have severe or profound disability (ABS 2019b).
Between 2003 and 2018, the prevalence rates of disability and of severe or profound disability generally decreased for both sexes, especially for people aged 65 and over (Figure PREVALENCE.1).
As the likelihood of disability increases with age, and the age structure of a population may change over time, this can affect meaningful comparisons of the changes in underlying disability prevalence rates. Age-standardised rates account for the differences in population structure, and allow better comparisons over time. Between 2003 and 2018, the age-standardised rate of disability fell from 20% to 16%, as did age-standardised rate of severe or profound disability (6.2% in 2003 to 5.2% in 2018) (ABS 2019a).
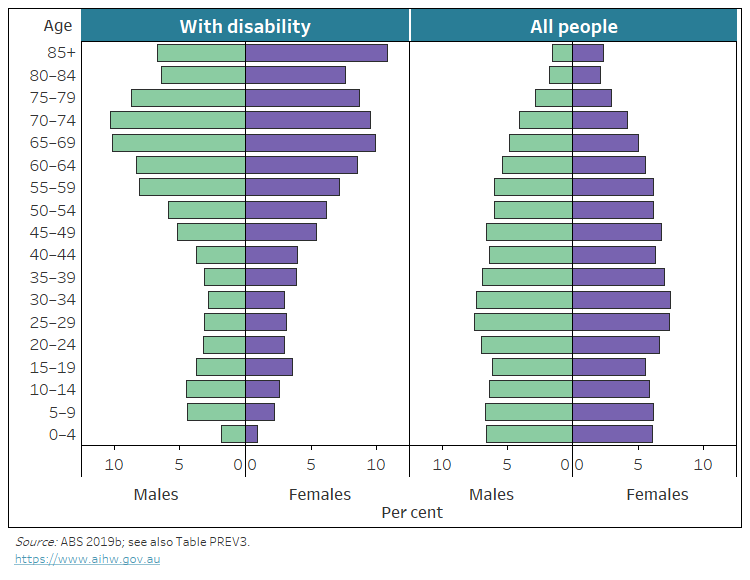
The Australian population is ageing, with 16% of the population aged 65 and over (Figure PREVALENCE.2). Half (50%) of people aged 65 and over have disability. The increased prevalence in disability with age (Figure PREVALENCE.1), combined with the ageing population, leads to a large proportion (44%) of people with disability in Australia who are aged 65 and over (ABS 2019b).
Figure PREVALENCE.2: Population distribution, by disability status, sex, and age group, 2018
The chart shows that people with disability tend to fall into older age groups than people without disability.
Source data tables: Data tables – Prevalence of disability. View data tables
Disability group
Disability group and type of disability
Disability group is a broad categorisation of disability. It is based on underlying health conditions and on impairments, activity limitations and participation restrictions. It is not a diagnostic grouping, nor is there a one-to-one correspondence between a health condition and a disability group.
The ABS SDAC broadly groups disabilities depending on whether they relate to functioning of the mind or the senses, or to anatomy or physiology. Each disability group may refer to a single disability or be composed of a number of broadly similar disabilities. The SDAC identifies 6 disability groups based on particular types of disability:
- sensory and speech disability group (includes loss of sight, loss of hearing, and speech difficulties disability types)
- intellectual (relates to difficulty learning or understanding things)
- physical (includes such disability types as breathing difficulties, blackouts, seizures or loss of consciousness, chronic or recurrent pain, incomplete use of limbs, and more)
- psychosocial (includes nervous or emotional conditions, mental illness, memory problems, and social or behavioural difficulties disability types)
- head injury, stroke or acquired brain injury disability group
- other disability (includes restrictions in everyday activities due to other long-term conditions or ailments) (ABS 2019c).
Prevalence of specific types of disability is discussed in ‘Disability type’ section of this report.
Generally, the prevalence of all disability groups increases with age, but for some disability groups there is also a decrease around the early adulthood years (Figure PREVALENCE.3). This is especially true for males:
- 4.2% (or 100,000) of males aged 0–14 have sensory disability compared with 1.8% (or 30,000) of those aged 15–24 and 1.1% (or 20,000) of those aged 25–34
- 5.8% (or 139,000) of males aged 0–14 have intellectual disability compared with 4.9% (or 79,000) of those aged 15–24 and 1.6% (or 30,000) of those aged 25–34 (ABS 2019b).
Girls aged 0–14 are less likely to have sensory disability or intellectual disability than boys, but there is also a decrease in prevalence of these 2 disability groups in early adulthood:
- 2.1% (or 47,000) of females aged 0–14 have sensory disability compared with 1.6% (or 24,000) of those aged 15–24 and 0.9% (or 17,000) of those aged 25–34
- 3.1% (or 71,000) of females aged 0–14 have intellectual disability compared with 2.9% (or 44,000) of those aged 15–24 and 1.3% (or 23,000) of those aged 25–34 (ABS 2019b).
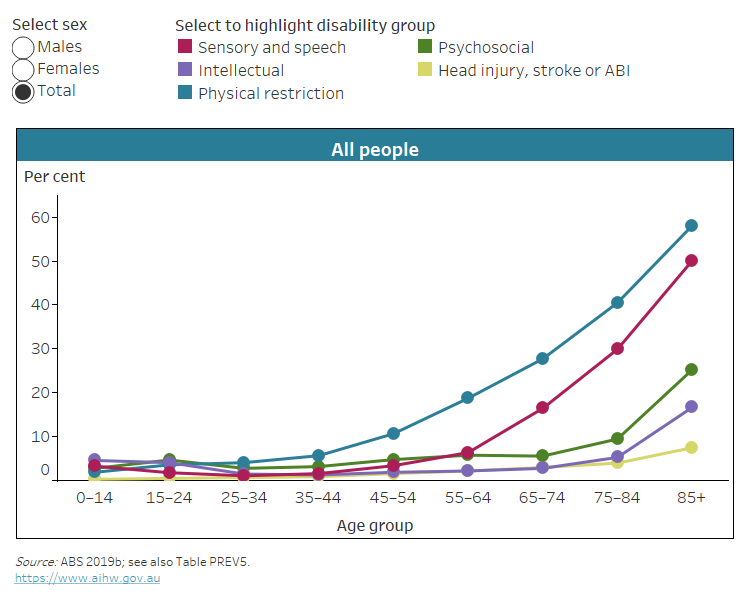
Figure PREVALENCE.3: Prevalence of disability group, by age group, 2018
This chart shows that physical disability is the most prevalent disability group from about 35 years of age, and intellectual for people under 15.
Notes:
** Relative standard error greater than 50% and is considered too unreliable for general use.
* Relative standard error of 25–50% and should be used with caution.
1. ABI refers to acquired brain injury.
Source data tables: Data tables – Prevalence of disability. View data tables
Boys aged 0–14 are more likely (3.4% or 83,000) to have psychosocial disability than girls (1.9% or 43,000). There is an increase in psychosocial disability in both males (4.5% or 71,000) and females (4.4% or 68,000) at age 15–24 and then a decrease at age 25–34 (2.8% or 51,000 and 2.6% or 48,000 respectively) (ABS 2019b).
The prevalence of physical disability and sensory disability increases sharply after age 35–44 (Figure PREVALENCE.3):
- 5.6% (or 183,000) of people aged 35–44 have physical disability and 1.5% (or 49,000) have sensory disability
- 11% (or 335,000) and 3.3% (or 103,000) of those aged 45–54
- 19% (or 535,000) and 6.3% (or 180,000) of those aged 55–64
- 28% (or 617,000) and 16% (or 366,000) of those aged 65–74
- 40% (or 482,000) and 30% (or 357,000) of those aged 75–84
- 58% (or 285,000) and 50% (or 246,000) of those aged 85 and over (ABS 2019b).
Females aged 85 and over are more likely to have physical disability (63% or 192,000) and less likely to have sensory disability (47% or 141,000) than males (50% or 94,000 and 56% or 105,000 respectively) (ABS 2019b).
The prevalence of intellectual disability, psychosocial disability, and head injury, stroke or acquired brain injury increases considerably from age 65–74 (Figure PREVALENCE.3):
- 2.7% (or 59,000) of people aged 65–74 have intellectual disability, 5.2% (or 62,000) of those aged 75–84, and 17% (or 81,000) of those aged 85 and over
- 5.5% (or 122,000) of people aged 65–74 have psychosocial disability, 9.4% (or 112,000) of those aged 75–84, and 25% (or 124,000) of those aged 85 and over
- 2.9% (or 64,000) of people aged 65–74 have head injury, stroke or acquired brain injury, 3.9% (or 47,000) of those aged 75–84, and 7.4% (or 36,000) of those aged 85 and over (ABS 2019b).
Females aged 85 and over are more likely to have intellectual disability (19% or 57,000) or psychosocial disability (27% or 82,000) than males (13% or 24,000 and 22% or 41,000 respectively) (ABS 2019b).
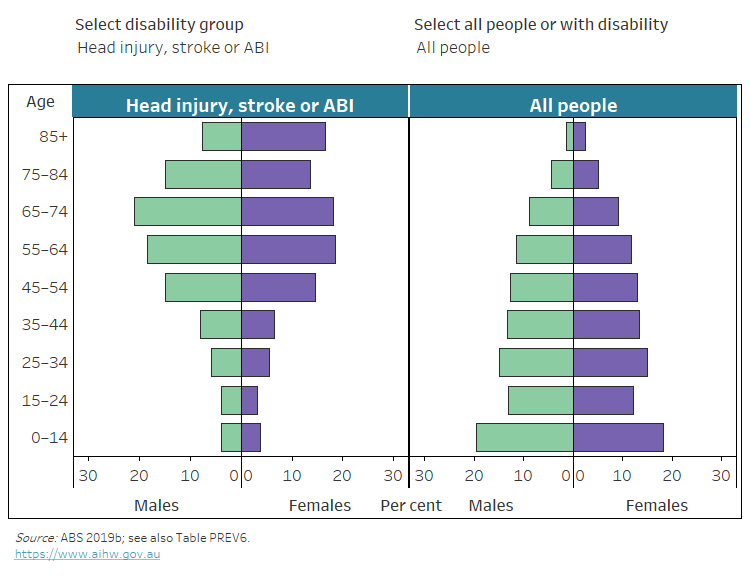
The age distribution of people with disability differs substantially by disability group (Figure PREVALENCE.4):
- People with sensory or speech disability are most likely to be aged 65 and over; this is in contrast to the Australian population as a whole where most people are aged under 65.
- The proportion of people aged under 25 is higher in people with intellectual disability than in the total population.
- Most people with physical disability are between ages 55 and 84.
- Most people with head injury, stroke or acquired brain injury are aged 45 and over.
- People with psychosocial disability are distributed more evenly across all age groups than any other disability group.
Figure PREVALENCE.4: Population distribution, by disability group, age group and sex, 2018
The chart shows that, for most disability groups (except intellectual and psychosocial), people with disability tend to fall into older age groups.
Notes:
** Relative standard error greater than 50% and is considered too unreliable for general use.
* Relative standard error of 25–50% and should be used with caution.
1. ABI refers to acquired brain injury.
Source data tables: Data tables – Prevalence of disability. View data tables
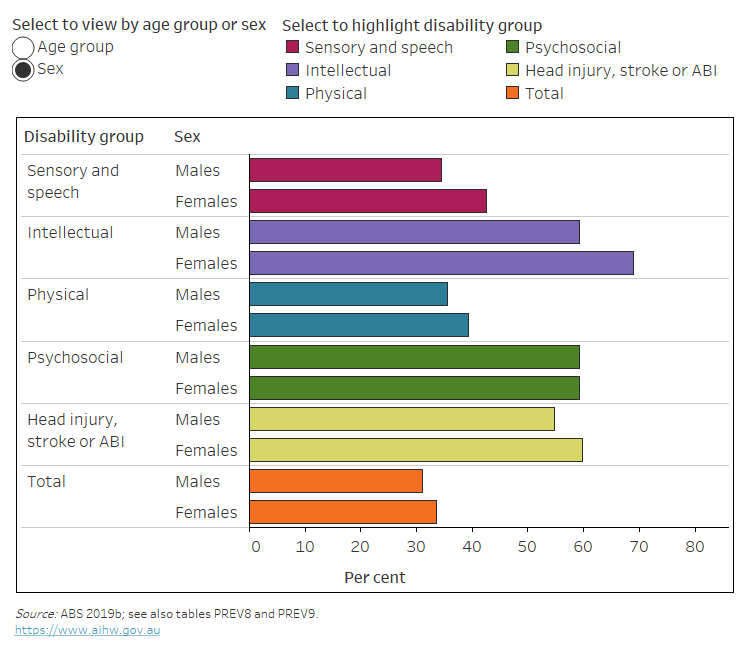
Whether people with disability have severe or profound disability differs by age group, sex and disability group (Figure PREVALENCE.5):
- Of all people with disability, those aged 25–64 are the least likely to have severe or profound disability (23% or 411,000), while those aged under 25 are the most likely (49% or 317,000).
- Of people with intellectual or psychosocial disability, those aged 65 and over have the highest likelihood of severe or profound disability; 82% of those with intellectual disability and 80% of those with psychosocial disability in this age group have severe or profound disability.
- Females with sensory disability (43% or 281,000), or intellectual disability (69% or 213,000) are more likely to have severe or profound disability than males (35% or 303,000 and 59% or 259,000 respectively) (ABS 2019b).
Figure PREVALENCE.5: Severe or profound disability in people with disability, by disability group, age group and sex, 2018
The chart shows that 4 in 5 people aged 65 and over with intellectual or psychosocial disability have severe or profound disability.
Notes:
- ABI refers to acquired brain injury.
- People with head injury, stroke or acquired brain injury are included in the aggregated total but are not shown separately by age group due to uncertainty over data quality.
Source data tables: Data tables – Prevalence of disability. View data tables
Disability type
Broad disability groups can include different types of disability. This section looks at prevalence of different disability types among all people with disability.
Sensory disability includes loss of sight, loss of hearing and speech difficulties. Which type of sensory disability people with disability have varies by age group (Figure PREVALENCE.6):
- One in 4 (26% or 169,000) people aged under 25 with disability have speech difficulties compared with 3.5% (62,000) of those aged 25–64 and 5.4% (104,000) of those aged 65 and over.
- Two in 5 (41% or 800,000) people aged 65 and over with disability experience loss of hearing compared with 14% (or 246,000) of those aged 25–64 and 4.3% (or 28,000) of those aged under 25.
- Almost 1 in 10 (8.7% or 169,000) people aged 65 and over with disability experience loss of sight compared with 3.9% (or 69,000) of those aged 25–64 and 2.7% (or 17,000) of those aged under 25 (ABS 2019b).
Physical disability includes breathing difficulties, blackouts, seizures or loss of consciousness, chronic or recurring pain or discomfort, incomplete use of arms or fingers, difficulty gripping or holding things, incomplete use of feet or legs, restriction in physical activities or work, and disfigurement or deformity. The occurrence of most physical disability types increases with age (Figure PREVALENCE.6):
- Restrictions in physical activities or work are common in people with disability of all age groups, but increase with age (12% or 75,000 of those aged under 25, 40% or 707,000 of those aged 25–64 and 46% or 892,000 of those aged 65 and over).
- People with disability aged 25–64 (40% or 704,000) or 65 and over (37% or 715,000) are more likely to experience chronic or recurring pain or discomfort than those aged under 25 (5.9% or 39,000).
- Younger people with disability aged under 25 are more likely (7.4% or 48,000) to have blackouts, seizures or loss of consciousness than those aged 25–64 (5.5% or 98,000) or 65 and over (4.5% or 87,000) (ABS 2019b).
Psychosocial disability includes nervous or emotional conditions, mental illness, memory problems or periods of confusion, and social or behavioural difficulties. The type of psychosocial disability people with disability experience varies by age group (Figure PREVALENCE.6):
- People with disability aged under 25 (20% or 128,000) or 25–64 (20% or 358,000) are more likely to have a nervous or emotional condition than those aged 65 and over (7.7% or 149,000).
- One in 5 (21% or 135,000) people with disability aged under 25 have a mental illness, compared with 8.1% (or 144,000) of those aged 25–64 and 8.7% (or 168,000) of those aged 65 and over.
- Social or behavioural difficulties decrease with age in people with disability (25% or 165,000 of those aged under 25, 9.8% or 175,000 of those aged 25–64 and 5.9% or 115,000 of those aged 65 and over).
- Memory problems or periods of confusion increase with age in people with disability (6.7% or 44,000 of those aged under 25, 8.9% or 159,000 of those aged 25–64 and 12% or 226,000 of those aged 65 and over) (ABS 2019b).
Figure PREVALENCE.6: Disability type of people with disability, by age group, 2018
The chart shows that most common disability types are restriction in physical activities (38% of people), chronic pain (33%), and hearing loss (25%).
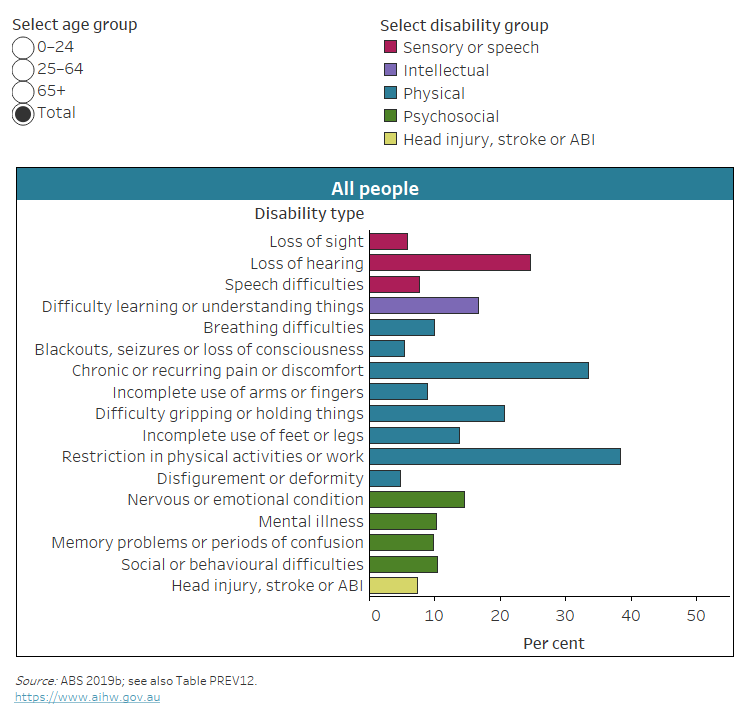
Note: ABI refers to acquired brain injury.
Source data tables: Data tables – Prevalence of disability. View data tables
Main health condition
For about 3 in 4 (77%) people with disability, their main health condition (that is, the condition causing the most problems) is physical (ABS 2019a). This includes diseases of the:
- musculoskeletal system and connective tissue (30%), such as back problems and arthritis
- ear and mastoid process (8.4%), such as hearing loss and tinnitus
- circulatory system (6.3%), such as heart disease and stroke
- nervous system (6.7%), such as cerebral palsy and multiple sclerosis (ABS 2019b).
For the remaining 1 in 4 (23%), their main condition is mental or behavioural, including:
- intellectual and developmental (6.5%), such as intellectual disability and autism
- mood affective (3.8%), such as depression
- dementia and Alzheimer's disease (2.6%) (ABS 2019a, 2019b).
The rate (or prevalence) of disability within specific health conditions is not covered in this section. For information on this for selected chronic conditions see ‘Chronic conditions and disability’.
What is the relationship between health conditions and disability?
The relationship between a health condition and a person's experience of disability is often complex.
Disability is a multi-dimensional concept that involves the interaction between a health condition and:
- environmental factors, such as community attitudes and access to services
- personal factors, such as a person's age and sex.
These factors interact with a health condition to have positive or negative influences on a person's ability to perform everyday activities and participate in different aspects of life. As such, people with similar health conditions can have quite different experiences of disability; and the same health condition may contribute to disability in one person but not in another.
For more information, see ‘Defining disability’ and the World Health Organization's International Classification of Functioning, Disability and Health (ICF).
Causes of disability
The causes of disability are complex and often unidentified. The SDAC collects data about the cause of the main health condition (the condition causing the most problems). Not all people with health conditions have disability, and, for those with disability, their main condition may or may not be the cause of their disability.
The most common cause of the main condition for people with disability is that it ‘just came on’ (21% or 931,000), followed by diseases, illnesses or hereditary conditions (15% or 649,000) and accidents and injuries (12% or 515,000). This varies by disability level, sex, age group and disability group:
- The main health condition of people with severe or profound disability is more likely (10% or 146,000) to be present at birth than for people with other disability status (5.3% or 158,000).
- The main health condition of people with severe or profound disability is less likely (4.5% or 64,000) to be caused by work, working conditions or overwork than for people with other disability status (12% or 358,000).
- Males with disability are almost 3 times as likely (14% or 304,000) to have a main condition that was caused by work, working conditions or overwork as females (5.4% or 120,000).
- Males are less likely to have a main condition that just came on (19% or 411,000), or was caused by disease, illness or hereditary factors (13% or 269,000) than females (23% or 521,000 and 17% or 380,000 respectively).
- One in 4 (25% or 165,000) people with disability aged under 25 have a main condition that was present at birth, compared with 6.5% (or 116,000) of those aged 25–64 or 1.2% (or 23,000) of those aged 65 and over.
- People aged 25–64 with disability are more likely (17% or 303,000) to have a main condition that was caused by an accident or injury than those aged under 25 (3.7% or 24,000) or 65 and over (9.6% or 187,000).
- One in 7 (15% or 286,000) people aged 65 and over have a main condition that was caused by old age.
- The most common cause of main condition in people with intellectual disability is that it was present at birth (22% or 164,000), while people with head injury, stroke or acquired brain injury are most likely to have a main condition caused by an accident or injury (25% or 82,000).
- About 1 in 5 people with sensory disability, physical disability, or psychosocial disability have a main condition that just came on (21% or 320,000, 21% or 589,000 and 19% or 213,000 respectively) (ABS 2019b).
Of the 1 in 8 (12% or 515,000) people with disability who are disabled as a result of an accident or injury, the incident most commonly happened on the road (30% or 154,000) or at work (29% or 146,000), followed by at home (18% or 92,000) and at sporting venues (7.6% or 39,000) (ABS 2019b).
One in 8 (13% or 543,000) people with disability living in households were aged under 5 when the main health condition set in or the accident happened. Males are more likely to have been aged under 5 when that happened, especially those with severe or profound disability:
- males with severe or profound disability are twice as likely (30% or 184,000) to have been aged under 5 than females (15% or 94,000)
- males with other disability status are slightly more likely (9.8% or 145,000) than females (8.0% or 118,000) (ABS 2019b).
The age at onset of main condition or when accident happened also varies by disability group. Forty-one per cent (or 262,000) of people with intellectual disability were aged under 5 at onset of main condition or when the accident happened; 19% (or 185,000) of those with psychosocial disability; 17% (or 239,000) of those with sensory or speech disability; 9.9% (28,000) of those with head injury, stroke or acquired brain injury, and 7.9% (206,000) of those with physical disability (ABS 2019b).
ABS (Australian Bureau of Statistics) (2004) Microdata: disability, ageing and carers, Australia, 2003, ABS cat. no. 4430.0.30.002, ABS AIHW analysis of TableBuilder data, accessed 3 June 2020.
ABS (2010) Microdata: disability, ageing and carers, Australia, 2009, ABS cat. no. 4430.0.30.002, ABS, AIHW analysis of TableBuilder data, accessed 3 June 2020.
ABS (2013) Microdata: disability, ageing and carers, Australia, 2012, ABS cat. no. 4430.0.30.002, ABS, AIHW analysis of TableBuilder data, accessed 3 June 2020.
ABS (2016) Microdata: disability, ageing and carers, Australia, 2015, ABS cat. no. 4430.0.30.002, ABS, AIHW analysis of TableBuilder data, accessed 3 June 2020.
ABS (2019a) Disability, ageing and carers, Australia: summary of findings, 2018, ABS, accessed 4 August 2021.
ABS (2019b) Microdata: disability, ageing and carers, Australia, 2018, ABS cat. no. 4430.0.30.002, ABS, AIHW analysis of TableBuilder data, accessed 14 July 2021.
ABS (2019c) Disability, ageing and carers, Australia: summary of findings methodology, 2018, ABS, accessed 7 February 2024.