Chest pain

Emergency department presentations with a principal diagnosis of chest pain (ICD-10-AM codes R07.1, R07.3, and R07.4) were analysed.

Nationally, there were increases in the presentation rate for chest pain across most weeks during the 2019–20 bushfire season, particularly in the early season from mid-September to the end of October 2019, and then from mid-January to early-February.

To explore national data and data for states and territories, see interactive data visualisations below (for data tables see Supplementary table S3).

Emergency department presentation rate, by jurisdiction, chest pain (ICD-10-AM code R07.1, R07.3, R07.4), weeks in 2019–20 bushfire season relative to previous year

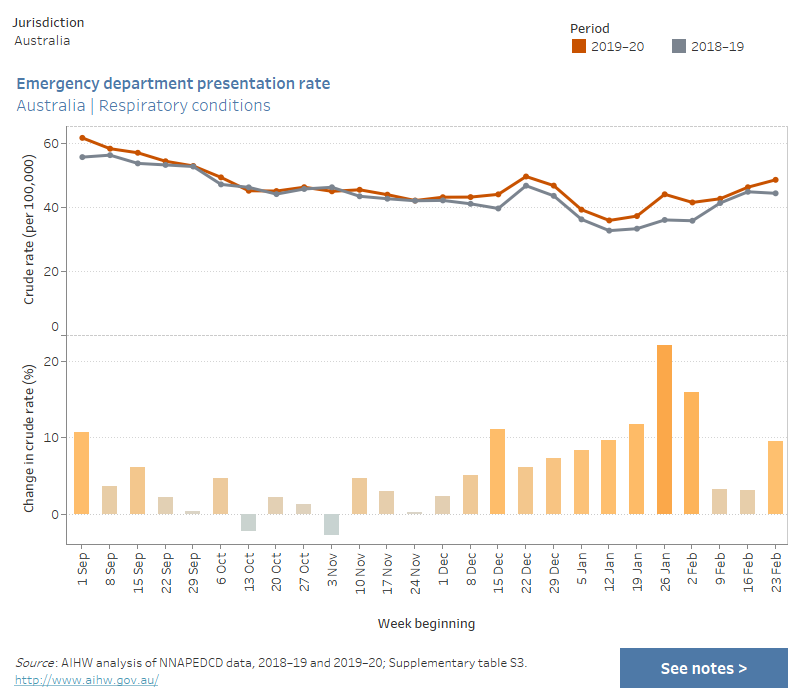
This combined chart shows the crude rate of emergency department presentations (per 100,000 persons) for chest pain for the periods 2019–20 and 2018–19, and the percentage change in crude rate between the two periods. Data are presented by jurisdiction and by week, for the period 1 September to 29 February/1 March, which correspond to the bushfire season. The chart shows that nationally, compared with the previous year, there were increases in the presentation rate across most weeks during the 2019–20 bushfire season, particularly in the early season from mid-September to the end of October 2019, and then from mid-January to early-February 2020. There were also variations at the jurisdictional level.

At the state and territory level, there were no consistent patterns between chest pain presentations coinciding with periods of significant fire activity or air pollution.

Similarly, no consistent patterns between air quality from bushfires and chest pain presentations were observed at the level of Statistical Area Level 4 (SA4).

For data by Statistical Area Level 4 (SA4), see Supplementary table S4.