Exploring the patient experience data
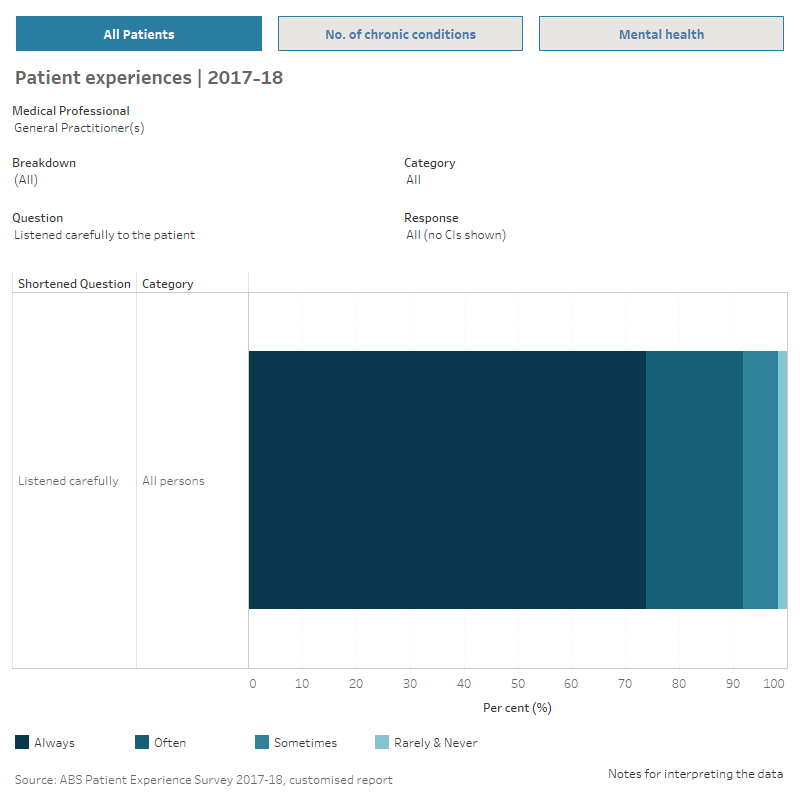
These data focus on the interactions that patients have with their health providers – specifically how often their general practitioners and specialists communicated in a respectful and attentive way. The Patient Experience Survey 2017–18, which is the data source used for this analysis, asks three questions about respondents’ recent experiences with their health care providers.
Thinking about all the GPs/medical specialists you have seen in the last 12 months…
- how often did they listen carefully to you?
- how often did they show respect for what you had to say?
- how often did they spend enough time with you?
Respondents indicated whether they had Always, Often, Sometimes, Rarely or Never experienced these sorts of interactions.
The experiences that patients had with their GPs and specialists in 2017-18 varied according to their age, sex, where they lived, their level of socioeconomic disadvantage, and their health.
Explore the data
Use the interactive data visualisation below to explore patient experiences for all respondents, by the number of reported chronic conditions and for respondents who reported having a mental health condition. All percentage estimates are reported with a 95% confidence interval (CI). Hover over the Notes for interpreting the data in the bottom right hand corner of the visualisation for detailed technical notes.
Data visualisation showing patient experiences 2017-18.