Australian Burden of Disease groups

The Australian Burden of Disease Study (ABDS) condition list contains 219 conditions in 17 groups. In this disease hierarchy, each disease is allocated to a disease group. The burden of disease groups contains related diseases or conditions—such as cardiovascular diseases, gastrointestinal disorders, or injuries—and one alternative reporting disease group (nature of injury instead of injury by external cause). These groups are listed in the figures below.

Not all health spending is directly related to a burden of disease condition or group. Some expenditure relates to interactions for purposes such as health maintenance (such as yearly health or dental checks) or investigation of potential health problems, which remain undiagnosed. These services are reported as signs and symptoms, interventions, examination and observation, and physical, behavioural social problems not elsewhere classified.

The condition groups with the highest spending were Musculoskeletal disorders followed by Cardiovascular diseases, and Cancer and other neoplasms.

  • The most expensive disease groups for admitted patients in public hospitals were Cardiovascular diseases, Injury and Gastrointestinal disorders. In private hospitals, these were Musculoskeletal disorders, Cardiovascular diseases, and Cancer and other neoplasms.
  • Spending on general practitioner services was highest for Infectious diseases, Mental and substance use disorders, followed by Musculoskeletal disorders.
  • More than half of spending for allied health and other health practitioners related to Mental and substance use disorders, with just over a quarter relating to Hearing and vision disorders.

Of the estimated $134 billion of health spending included in this study, approximately 7% related to signs and symptoms, interventions, examination and observation, and physical, behavioural social problems not elsewhere classified.

Figure Story D3: Expenditure by Australian Burden of Disease groups, 2018-19. This bar chart shows how health expenditure was allocated by Australian Burden of Disease groups in 2018-19. The condition groups with the highest spending were Musculoskeletal disorders ($13,864 million, 10.35% of total), followed by Cardiovascular diseases ($11,821 million, 8.82%) and Cancer and other neoplasms ($11,742 million, 8.76%). However, the most expensive disease group for Primary health care was Oral disorders, while spending on general practitioner services was the highest for Infectious disease. Over half of spending for allied health and other services was related to Mental and substance use disorders.

The proportion of total spending related to condition groups varies substantially according to age group, sex, and area of expenditure.

  • Spending on Infectious diseases was highest at ages 1-4, and slightly higher for males
  • Spending on Mental and substance use disorders was highest between ages 20 and 49, for males and females
  • Spending on chronic conditions such as Cancer and other neoplasms, Cardiovascular diseases and Endocrine disorders were highest from around age 50 onwards for males and females.

The following interactive data visualisations can be used to display spending on condition groups by age and sex, for each area of expenditure. Data used to create the visualisations can also be downloaded as an Excel workbook.

Figure D4: All areas of expenditure by demographics and disease group, 2018-19. This stacked bar chart shows how expenditure was allocated by demographics and disease group in 2018-19. The proportion of total spending associated with condition groups differed across age groups, sex, and area of expenditure. Spending on Infectious diseases was the highest at ages 1-4 ($640 million, 23.87% of total), and was slightly higher for females. However, for both males and females, spending on Mental and substance use disorders, Cancer and other neoplasms and Cardiovascular diseases was highest between ages 20 and 45 and from age 50 onwards.

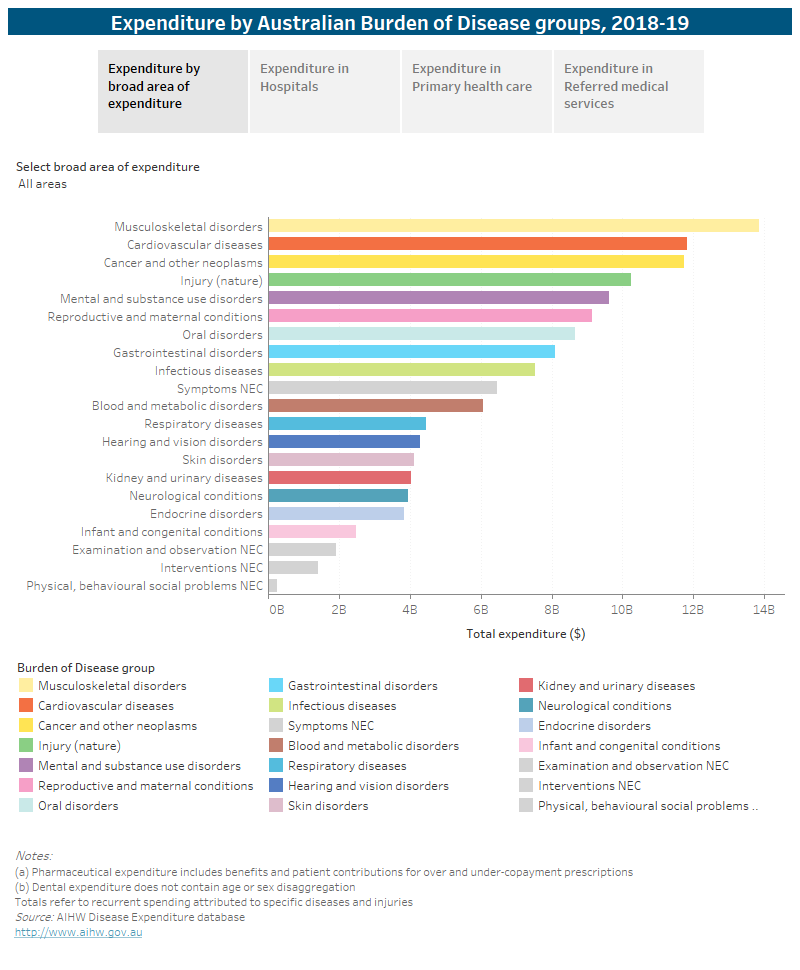
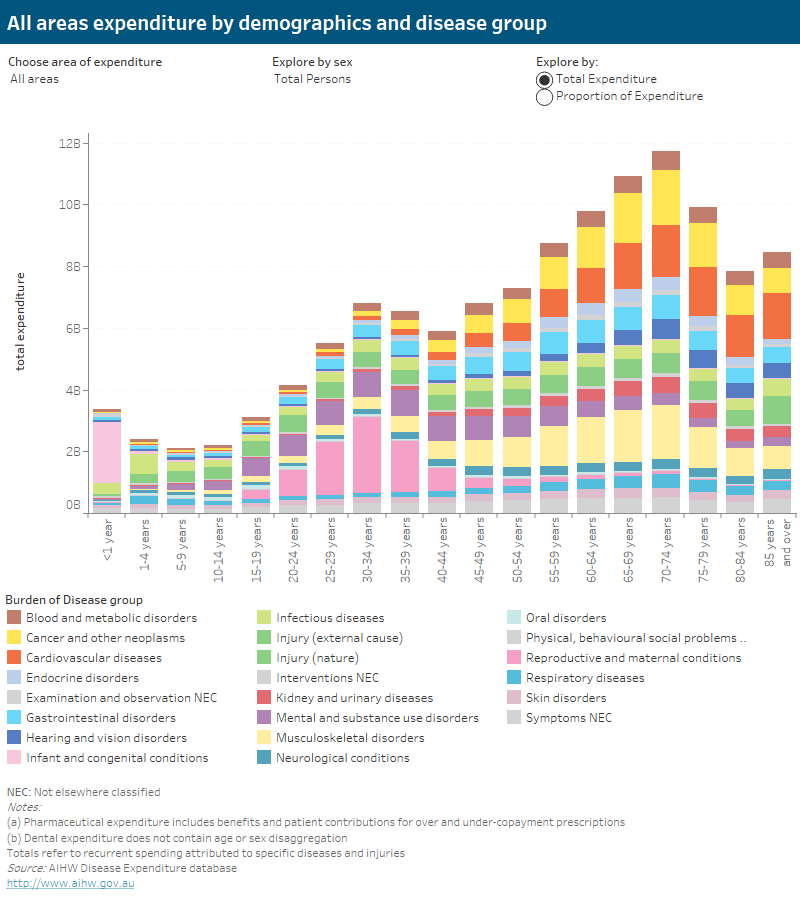
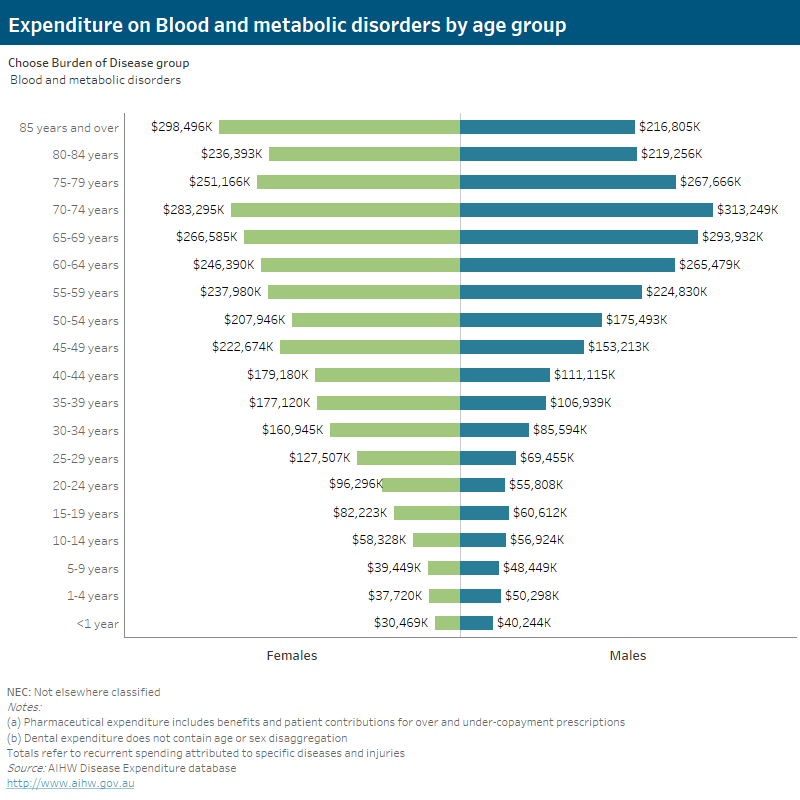
Figure D5: Expenditure on disease group by age group and sex, 2018-19. This butterfly chart shows how disease expenditure was allocated by age group and sex in 2018-19. The proportion of total spending on disease groups varied by age and sex. Spending on Cardiovascular diseases and Reproductive and maternal conditions was the highest for males and females, respectively. However, the bulk of expenditure on disease group tends to occur later in life, regardless of sex.