Comparison with 2018-19

Estimated spending by disease increased by $6.5 billion (in current prices) to $140.4 billion in 2019–20, up from
$134.0 billion in 2018‑19. This was an overall growth of 4.8% in nominal terms (current prices). This compares to a nominal growth of 3.7% in total health spending in 2019–20 reported in Health expenditure Australia 2020–21. As the disease expenditure study allocates around 73% of recurrent health spending to disease groups, the growth in spending on those areas of expenditure that are excluded from the disease expenditure study such as public health, community health, health administration, health research and capital expenditure may have contributed to the lower overall growth in total health spending.

The following visualisation shows the growth in spending in nominal terms between 2018–19 and 2019–20 for each disease group. Data used to create the visualisation can also be downloaded as an Excel workbook.

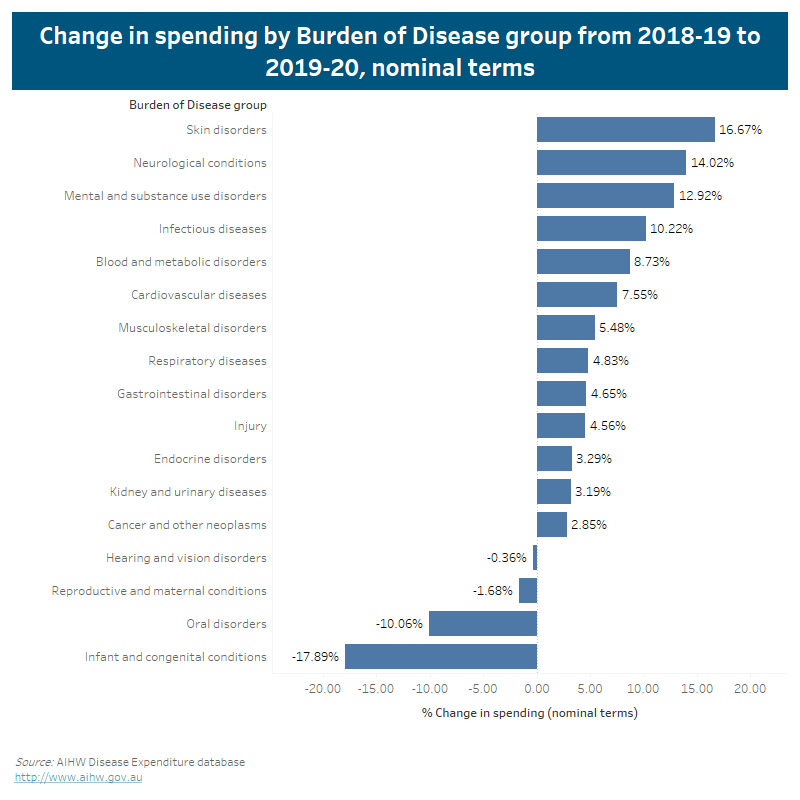
This bar chart shows the change in spending by Burden of Disease group from 2018-19 to 2019-20 in nominal terms where prices are unadjusted for inflation. The biggest increase in spending was for Skin disorders (16.67%), followed by Neurological conditions (14.02%) and Mental and substance use disorders (12.92%). There was a decline in growth for infant and congenital conditions (-17.89%), oral disorders (-10.06%) and reproductive and maternal conditions (-1.68%) in 2019-20.

The following visualisation shows the growth in spending in nominal terms between 2018–19 and 2019–20 for each disease group by sex and age group. Data used to create the visualisation can also be downloaded as an Excel workbook.

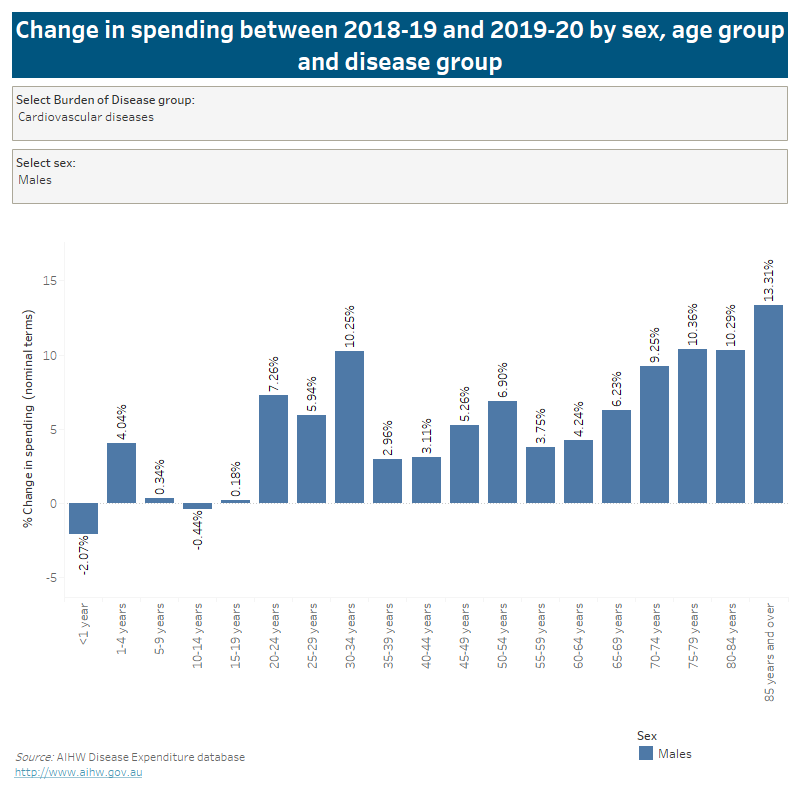
This bar chart shows the change in spending between 2018-19 and 2019-20 by sex, age group and disease group. The trends in the change in spending vary across sex, age group, and disease group. For many Burden of Disease groups, the biggest increase in spending was often amongst those aged 85 years and over.

In 2019–20:

  • Musculoskeletal disorders continued to rank the highest disease group for health spending followed by cardiovascular diseases and cancers and other neoplasms
  • Mental and substance use disorders surpassed injuries to rank 4th highest for health spending
  • Gastrointestinal disorders and infectious diseases also both moved up one place in the rankings to 7th and 8th highest disease group respectively for health spending 
  • Oral disorders dropped two places from 7th in 2018–19 to 9th in 2019–20 for health spending.

The following interactive data visualisation shows the change in rank in terms of spending, for each disease group between 2018–19 and 2019–20. Data used to create the visualisation can also be downloaded as an Excel workbook.

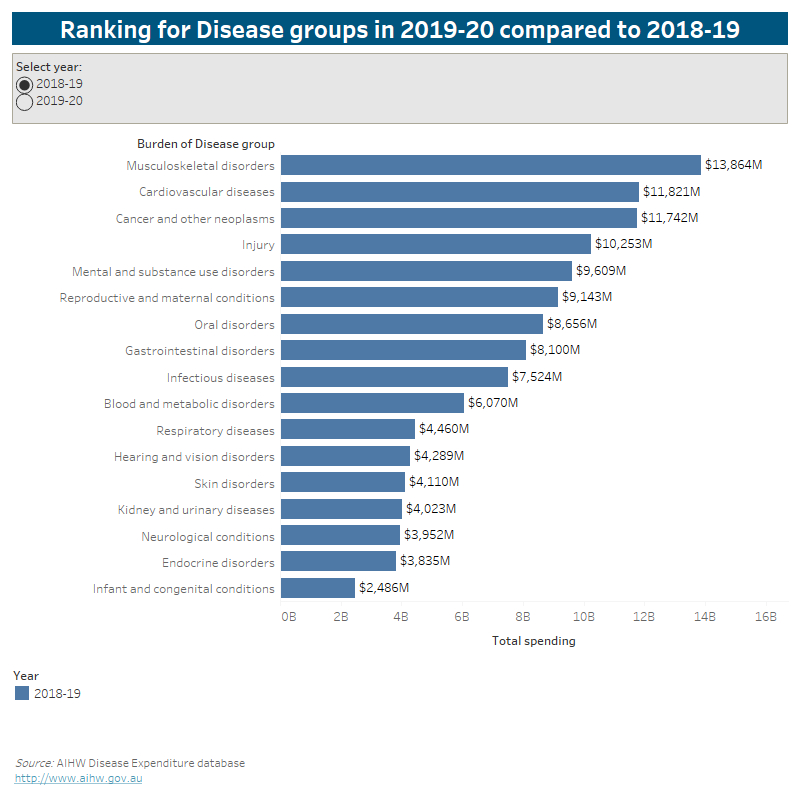
This bar chart shows the estimated expenditure for each disease group in descending order for 2018-19 and for 2019-20. It shows that in both years, the three disease groups with the highest spending were musculoskeletal disorders, cardiovascular diseases and cancer and other neoplasms. In 2019-20, mental and substance use disorders overtook injuries as the fourth leading disease group in terms of spending.