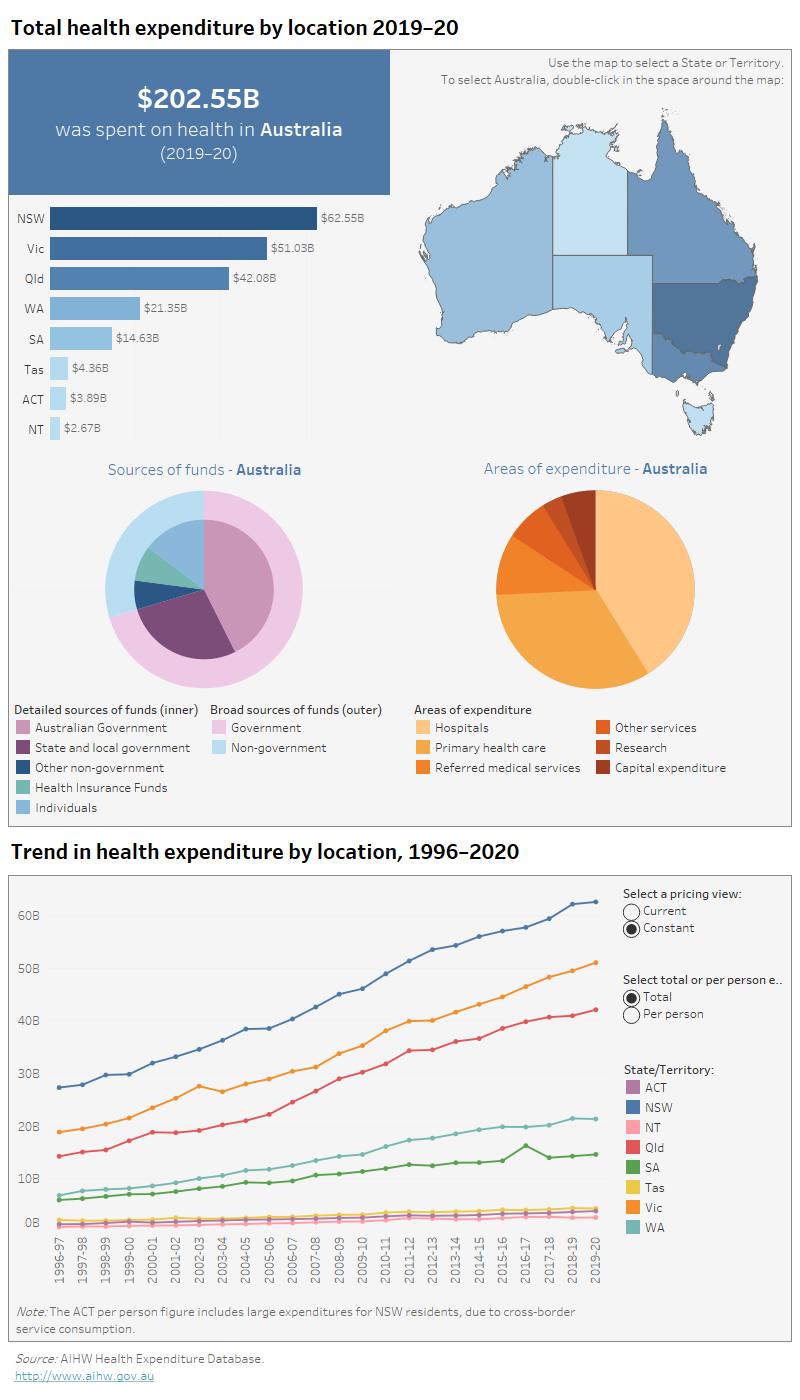
The ‘Spending by state’ figure illustrates total health spending, constant prices or current prices, by each state and territory, in the period from 1996–97 to 2019–20. This tab also presents health spending per person, constant prices or current prices, by each state and territory, in the period from 1996–97 to 2019–20.