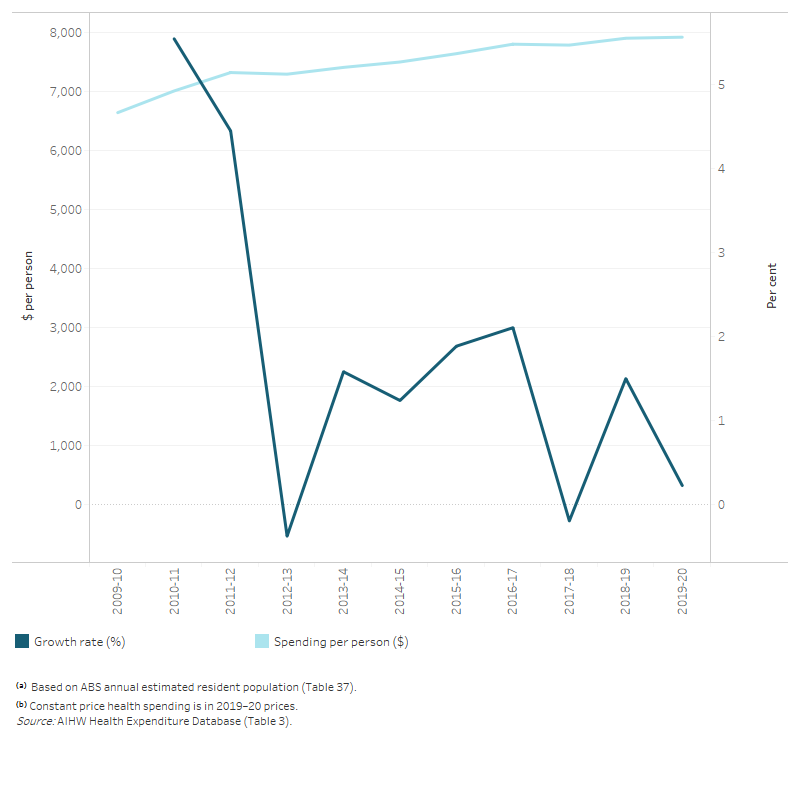
Health spending per person
The line graph shows that average total health spending per person in constant prices increased from $6,646 in 2009–10 to $7,326 in 2011–12 before decreasing to $7,299 in 2012–13. It then increased again to $7,926 in 2019–20. Annual growth rate in average total health spending per person ranged from –0.4 per cent and 5.5 per cent between 2009–10 and 2019–20. Annual growth rate in 2019–20 was 0.2 per cent, below the average annual growth rate in the last 5-year period.