Hospitals
During 2019–20, an estimate of $83.5 billion was spent on Australia's public and private hospitals, with $35.9 billion (43.0%) funded by state and territory governments and $31.4 billion (37.6%) by the Australian Government. The remaining $16.2 billion (19.4%) came from non‑government sources (Figure 24).
As outlined in the links belows, these estimates do not include some spending by the Australian Government through the MBS and PBS on services delivered in hospitals (up to $4.8 billion, including $2.1 billion in public hospitals and $2.7 billion in private hospitals) (see MBS, PBS in public hospitals and Australian National Health Account: concepts, methodology and data sources for more detail).
Spending on hospitals in 2019–20 was 2.9% higher than in 2018–19 and below the 3.6% average annual growth for the decade. The increase in 2019–20 resulted from increased funding by the Australian Government (7.9%), states and territories (5.1%) in real terms while spending by non-government entities declined by 9.5%. This increase of hospital spending was not accompanied by an increase in hospital activity, as the number of hospitalisations, emergency department and outpatient care services actually declined in 2019–20 (AIHW 2021a, 2021b, and 2021c). Note that growth calculations for Australian Government public hospital funding do not include additional components of MBS and PBS spending as stated above.
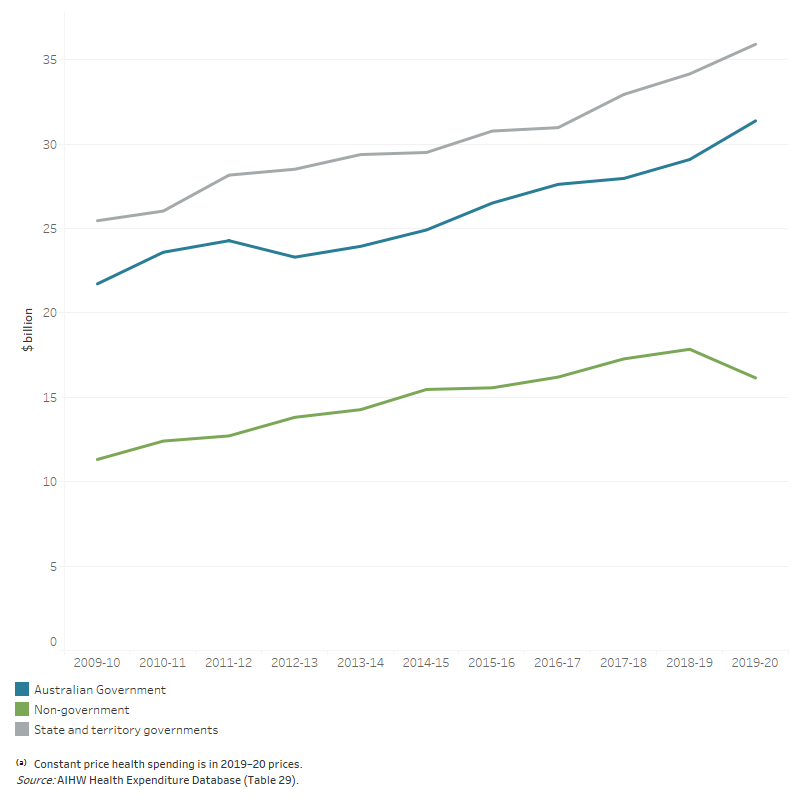
Figure 24: Spending on hospitals, by source of funds, constant prices⁽ᵃ⁾, 2009–10 to 2019–20
The line graph shows that spending on hospitals increased between 2009–10 and 2019–20 for the Australian Government, state and territory government and non-government sector. State and territory governments had the highest spending on hospitals in every year over the decade. State and territory government spending increased from $25.5 billion in 2009–10 to $35.9 billion in 2019–20. Spending by the Australian Government on hospitals slightly decreased from $24.3 billion in 2011–12 to $23.3 in 2012–13 but then increased every year to $31.4 billion in 2019–20. Non-government spending increased most of the years over the decade, from $11.4 billion in 2009–10 to $17.8 billion in 2018–19 before slightly decreasing to $15.2 billion in 2019–20.
Spending on public hospitals was estimated to be $66.4 billion (Figure 25, note that this figure does not include the $2.1 billion in MBS and PBS figures, as mentioned in MBS, PBS in public hospitals). Spending was up from $63.4 billion in 2018–19, a real increase of 4.7%, which was above the average annual real growth over the decade (3.8%).
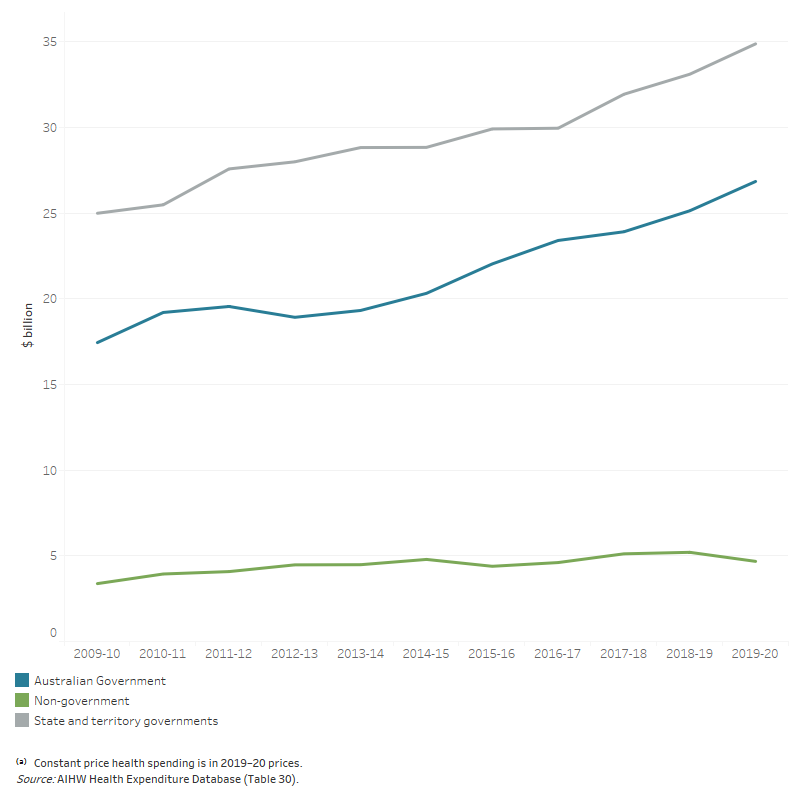
Figure 25: Public hospital spending, by source of funds, constant prices⁽ᵃ⁾, 2009–10 to 2019–20
The line graph shows that spending on public hospitals by the Australian Government, state and territory governments and non-government sector over the decade from 2009–10 to 2019–20. State and territory governments spent the most on public hospitals of all sources over the decade increased every year to $34.9 billion in 2019–20. Similarly, Australian Government spending on public hospitals decreased slightly in 2012–13, then increasing every other year to $26.8 billion in 2019–20. Non-government spending on public hospitals increased every year over the decade to $5.2 billion in 2018–19 before declining to $4.7 billion in 2019–20.
In 2019–20, state and territory governments contributed $34.9 billion (52.5%). This was followed by the Australian Government with between $26.8 billion (as currently estimated, or 40.4%) and $29 billion (42.3% if the MBS and PBS components are included) and non-government entities at $4.7 billion (7.0%). Growth in spending by the Australian Government was 6.8% in real terms, compared with 5.4% by state and territory governments while spending by non-government entities declined by 10.1% (Table 30). See more details on the Australian Government spending on public hospital services in the MBS, PBS in public hospitals and Table A11.
Over the 10-year period to 2019–20, overall spending increased in real terms by 3.8% on average per year, with the highest increase from Australian Government (4.4%), followed by state and territory governments (3.4%) and the non-government sector (3.3%) (Table 30).
See Australian National Health Account: concepts, methodology and data sources and Comparison and alignment of Australian health expenditure estimates for more information on data sources and methodologies, as well as a comparison and alignment between this report and other health spending figures published elsewhere, especially related to public hospitals spending.
Most (67.2%, $11.5 billion) of the estimated $17.1 billion spent on private hospitals was funded by the non-government sector:
- private health insurance providers, $8.6 billion
- individuals, $1.5 billion
- other non-government, $1.4 billion (Table A6).
Another estimated $4.5 billion (26.6%) was spent by the Australian Government (note that this estimate does not include the MBS and PBS components) and $1.1 billion (6.2%) by state and territory governments (Figure 26). Government spending in private hospitals can occur where state and territory governments contract with private hospitals to provide services to public patients, or where individual public hospitals buy services from private hospitals for public patients.
From 2018–19 to 2019–20, spending on private hospitals funded by the Australian Government grew in real terms by $0.6 billion (14.5%), mainly from the Private Financial Viability Payment under the NPCR. Meanwhile, non-government spending on private hospitals declined by 9.2% in real terms, most likely due to COVID-19 pandemic impacts.
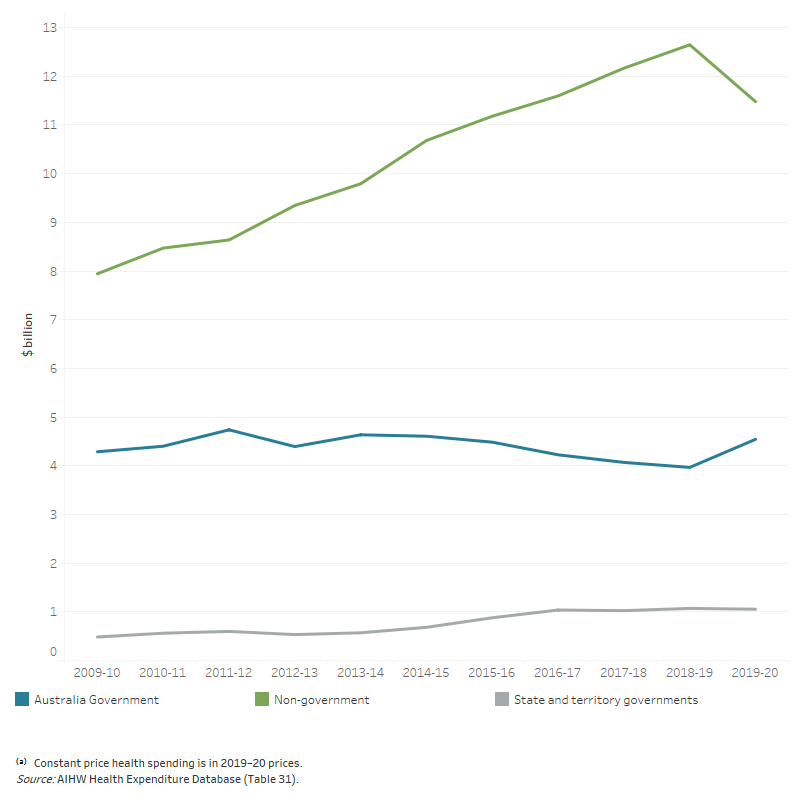
Figure 26: Private hospital spending, by source of funds, constant prices⁽ᵃ⁾, 2009–10 to 2019–20
The line graph shows that spending on private hospitals by the Australian Government, state and territory governments and non-government sector over the decade from 2009–10 to 2019–20. Non-government sector spent the most on private hospitals of all sources over the decade, increasing from $7.9 billion in 2009–10 to $12.6 billion in 2018–19 before declining to $11.5 billion in 2019–20. Australian Government spending on private hospitals increased from $4.2 billion in 2009–10 to $4.6 billion in 2014–15, then decreasing every year to $4.0 billion in 2018–19 before increasing again to $4.5 billion in 2019–20. State and territory government spending on private hospitals increased from $0.5 billion in 2009–10 to $1.0 billion in 2019–20.