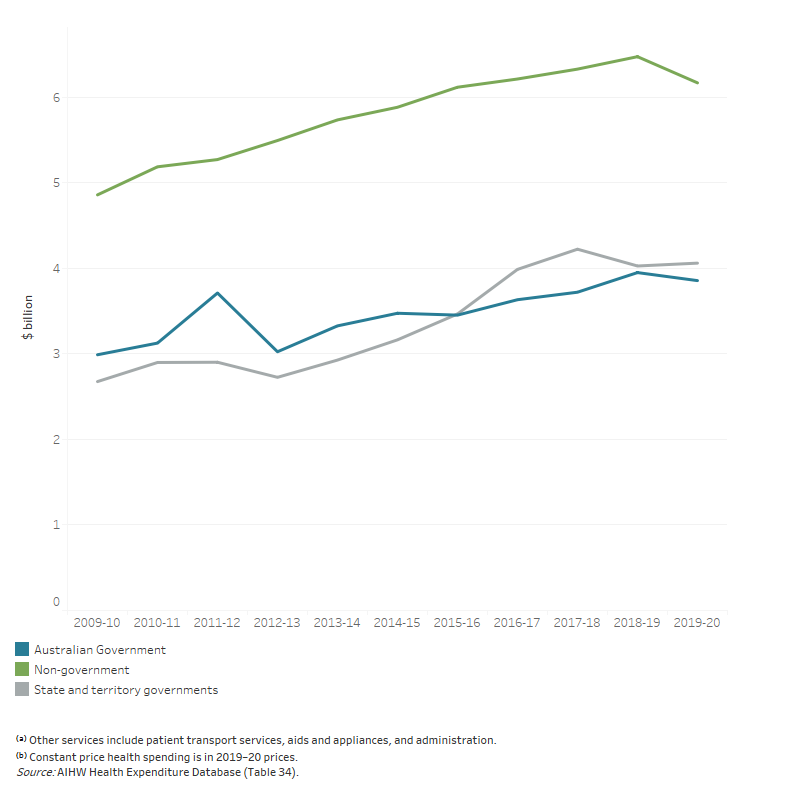
Other services

Estimated total spending on other services in 2019–20 was $14.1 billion. Of this:

  • $5.1 billion was spent on administration
  • $4.4 billion on aids and appliances
  • $4.6 billion on patient transport services (Table A6).

Overall:

  • non-government entities contributed $6.2 billion
  • state and territory governments $4.1 billion
  • Australian Government $3.9 billion (Figure 29).

Figure 29: Other services⁽ᵃ⁾ spending, by source of funds, constant prices⁽ᵇ⁾, 2009–10 to 2019–20

The line graph shows that spending on other services by Australian Government, state and territory government and non-government sector over the decade to 2019–20. Non-government spending increased from $4.6 billion in 2009–10 to $6.4 billion in 2018–19 before a slight decline to $6.2 billion in 2019–20. Australian Government spending increased less steadily, spiking to $3.7 billion in 2011–12 then decreasing to $3.0 billion in the following year, before gradually increasing to $3.9 billion in 2019–20. State and territory government spending increased every year except for 2012–13 and 2018–19, and was $2.7 billion in 2009–10 compared to $4.1 billion in 2019–20.

Compared with 2018–19, spending on other services decreased in real terms by $0.4 billion (2.5%) in 2019–20. This growth was attributable mainly to a decrease in non-government entities’ spending of $0.3 billion (4.7%). Australian Government spending decreased by $0.1 billion (2.4%) while spending by state and territory governments slightly increased by 0.8%.

In the decade since 2009–10, the real average annual growth rate on other services was 3.0%.