Hospitals

During 2020–21, an estimate of $89.7 billion was spent on Australia's public and private hospitals, with $38.4 billion (42.8%) funded by state and territory governments and $33.1 billion (36.9%) by the Australian Government. The remaining $18.2 billion (20.3%) came from non‑government sources (Figure 24).

As outlined in Australian Government spending section these estimates do not include some spending by the Australian Government through the MBS on services delivered in hospitals (up to $4.3 billion, including estimated $1.6 billion in public hospitals and $2.7 billion in private hospitals) (see MBS in public hospitals and Australian National Health Account: concepts, methodology and data sources for more detail).

Spending on hospitals in 2020–21 was 4.9% higher than in 2019–20 and above the 3.6% average annual growth for the decade. The increase in 2020–21 resulted from increased funding by non-government entities (11.0%), states and territories (6.3%), and the Australian Government (0.4%) in real terms. This increase in hospital spending was accompanied by an increase in hospital activity, as the number of hospitalisations, emergency department and outpatient care services increased in 2020–21 as COVID-19 restrictions eased in most states and territories. More specifically, the number of admitted patient care services, emergency department presentations, and non-admitted patient care services increased by 6.3%, 6.9%, and 23% respectively compared to 2019–20 (AIHW 2022a, 2022b, and 2022c). Note that growth calculations for Australian Government public hospital funding do not include additional components of MBS spending as stated above.

Figure 24: Spending on hospitals, by source of funds, constant prices(a), 2010–11 to 2020–21

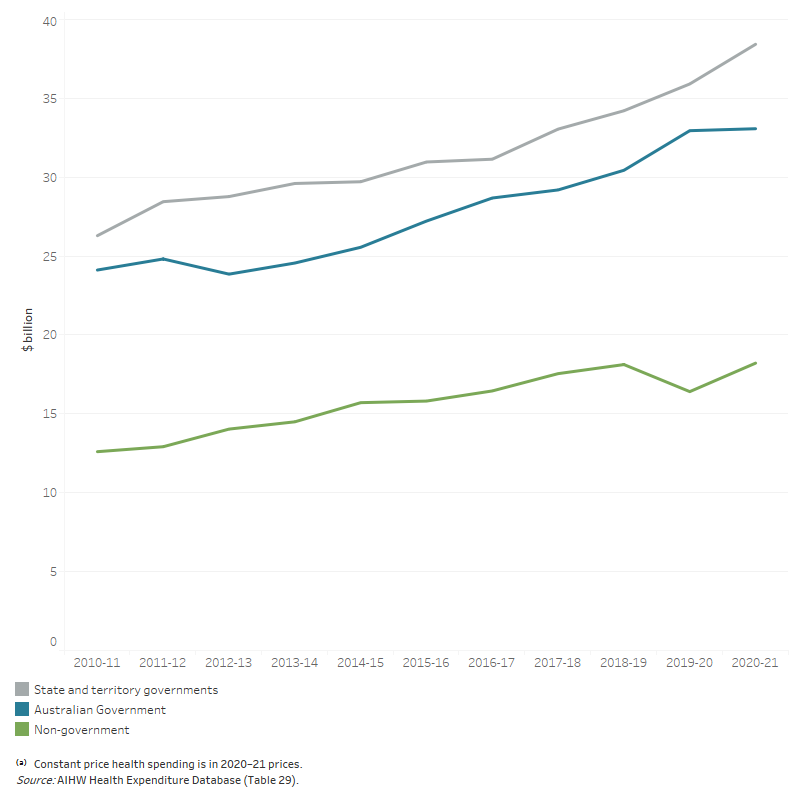
The line graph shows that spending on hospitals increased between 2010–11 and 2020–21 for the Australian Government, state and territory government and non-government sector. State and territory governments had the highest spending on hospitals in every year over the decade. State and territory government spending increased from $26.3 billion in 2010–11 to $38.4 billion in 2020–21. Spending by the Australian Government on hospitals slightly decreased from $24.8 billion in 2011–12 to $23.9 in 2012–13 but then increased every year to $33.1 billion in 2020–21. Non-government spending increased most of the years over the decade, from $12.6 billion in 2010–11 to $18.1 billion in 2018–19, then decreased to $16.4 billion in 2019–20 before bounced back to $18.2 billion in 2020–21.

Public hospitals

Spending on public hospitals was estimated to be $70.5 billion (Figure 25, note that this figure does not include the $1.6 billion in MBS figures, as mentioned in the MBS in public hospitals). Spending was up from $67.6 billion in 2019–20, a real increase of 4.4%, which was above the average annual real growth over the decade (3.6%).

Figure 25: Public hospital spending, by source of funds, constant prices(a), 2010–11 to 2020–21

The line graph shows that spending on public hospitals by the Australian Government, state and territory governments and non-government sector over the decade from 2010–11 to 2020–21. State and territory governments spent the most on public hospitals of all sources over the decade increased every year to $37.3 billion in 2020–21. Similarly, Australian Government spending on public hospitals decreased slightly in 2012–13, then increasing every other year to $28.1 billion in 2020–21. Non-government spending on public hospitals increased every year over the decade to $5.3 billion in 2018–19, then decreased to $4.8 billion on 2019–20 before increased again to $5.2 billion in 2020–21.

In 2020–21, state and territory governments contributed $37.3 billion (52.9%). This was followed by the Australian Government with between $28.1 billion (as currently estimated, or 39.8%) and $29.7 billion (40.4% if the MBS components are included) and non-government entities at $5.2 billion (7.3%). Growth in spending by the Australian Government was 0.8% in real terms, compared with 6.6% by state and territory governments and 9.0% by non-government entities (Table 30). See more details on the Australian Government spending on public hospital services in MBS in public hospitals box and Table A11.

Over the 10-year period to 2020–21, overall spending increased in real terms by 3.6% on average per year, with the highest increase from state and territory governments (3.8%), followed by Australian Government (3.6%) and the non-government sector (2.6%) (Table 30).

See Australian National Health Account: Overview of data sources and methodology for more information on data sources and methodologies, as well as a comparison and alignment between this report and other health spending figures published elsewhere, especially related to public hospitals spending.

Private hospitals

Most (68.1%, $13.0 billion) of the estimated $19.1 billion spent on private hospitals was funded by the non-government sector:

  • private health insurance providers, $9.2 billion
  • individuals, $2.4 billion
  • other non-government, $1.4 billion (Table A6).

Another estimated $5.0 billion (26.3 %) was spent by the Australian Government (note that this estimate does not include the MBS components) and $1.1 billion (5.6%) by state and territory governments (Figure 26). Government spending in private hospitals can occur where state and territory governments contract with private hospitals to provide services to public patients, or where individual public hospitals buy services from private hospitals for public patients.

From 2019–20 to 2020–21, non-government spending on private hospitals increased by $1.4 billion (11.8%) in real terms. Spending on private hospitals funded by the Australian Government declined in real terms by $0.1 billion (1.8%). During the same time, the number of admissions in private hospitals increased by 10.5% after declining by 4.2% in 2019–20 (AIHW 2022a).

Figure 26: Private hospital spending, by source of funds, constant prices(a), 2010–11 to 2020–21

The line graph shows that spending on private hospitals by the Australian Government, state and territory governments and non-government sector over the decade from 2010–11 to 2020–21. Non-government sector spent the most on private hospitals of all sources over the decade, increasing from $8.6 billion in 2010–11 to $12.8 billion in 2018–19, then decreased to $11.7 billion in 2019–20 before bounced back to $13.0 billion in 2020–21. Australian Government spending on private hospitals increased from $4.5 billion in 2010–11 to $4.7 billion in 2014–15, then decreasing every year to $4.4 billion in 2018–19 before increasing again to $5.0 billion in 2020–21. State and territory government spending on private hospitals increased from $0.5 billion in 2010–11 to $1.0 billion in 2020–21.