Non-government sources

In 2020–21, non-government sources spent $64.9 billion on health (Figure 17a). At $33.2 billion (51.1%), individuals contributed above half of non-government health spending, private health insurance providers $18.0 billion (27.8%) and other non-government sources $13.7 billion (21.1%).

It appears that the gradual easing of COVID-19 restrictions played an important role in the rebound of non-government spending in 2020–21, as people may have been catching up on care/treatment services that were delayed previously. However, note that the actual non-government health spending was still below the 10-year trend before the pandemic (2008–09 to 2018–19, Figure 17b).

Figure 17a: Non-government health spending, constant prices(a), by source of funds, 2010–11 to 2020–21

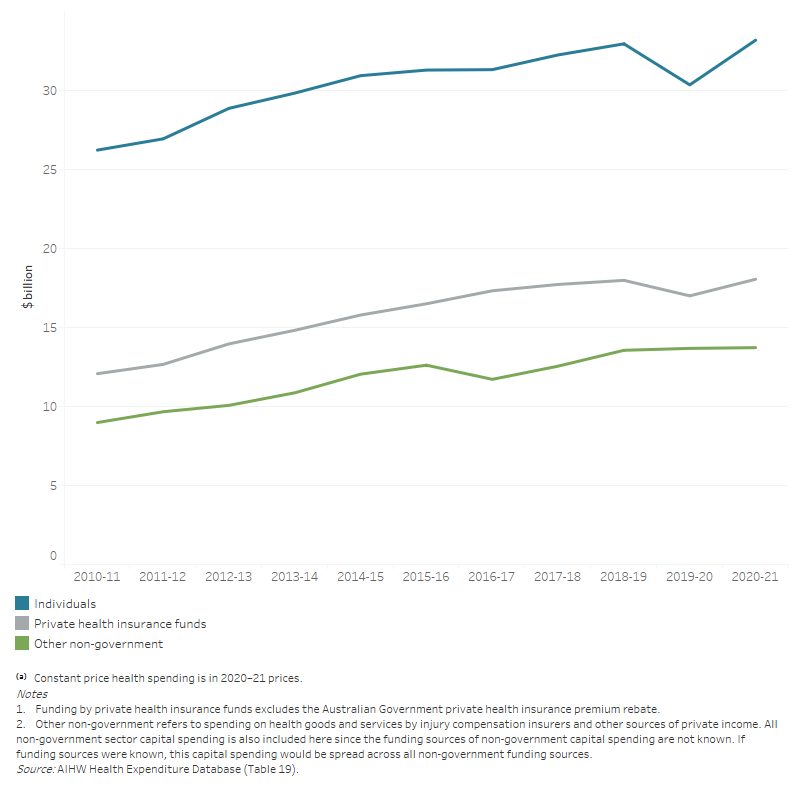
The line graph shows that spending by individuals increased each year and overall from $26.2 billion in 2010–11 to $33.2 billion in 2020–21. Spending by private health insurance funds also increased each year and overall from $12.1 billion in 2010–11 to $18.0 billion in 2020–21. Apart from the decrease in 2016–17, over the 10-year period other non-government spending increased overall from $9.0 billion in 2010–11 to $13.7 billion in 2020–21.

Figure 17b: Non-government health spending, constant prices, in the 2 years during the COVID-19 pandemic (2019–20 to 2020–21) compared to the trend of the previous 10-year period (2008–09 to 2018–19)

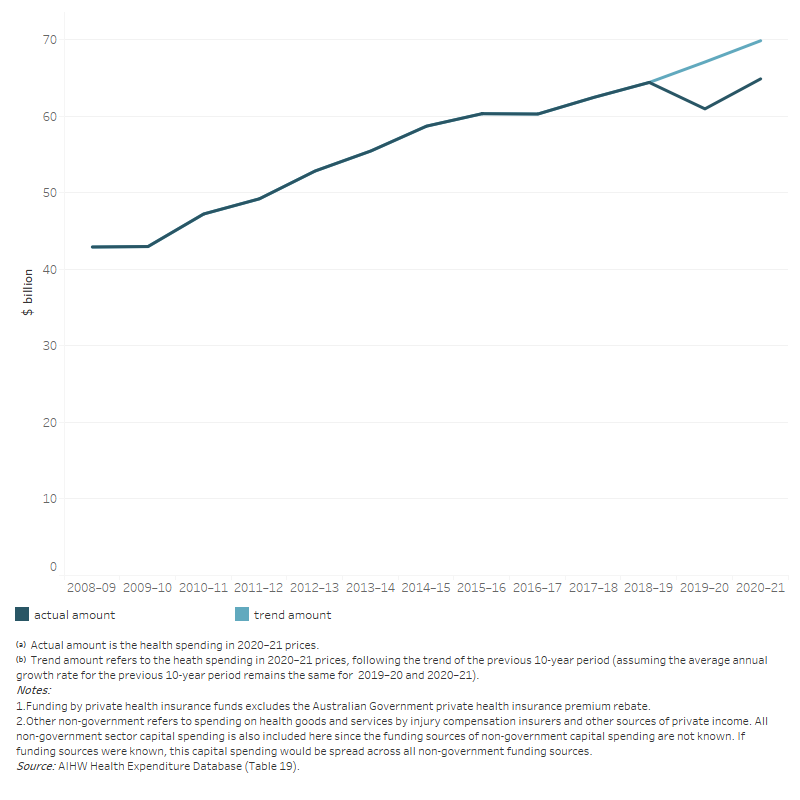
The line graph shows the total non-government health spending, in the two years during the COVID-19 pandemic (2019–20 to 2020–21) compared to the trend of the previous 10-year period (2008–09 to 2018–19). Assuming the average growth rate for the previous 10-year period remains the same for 2019–20 and 2020–21, the trend amounts of non-government health spending in constant prices for 2019–20 and 2020–21 were $67.1 billion, $69.9 billion respectively. While the actual amounts for these years were $61.0 billion and $69.9 billion, respectively.

Individual spending

Individuals spent an estimate of $33.2 billion out-of-pocket on health goods and services in 2020–21. This was 9.3% more than in 2019–20 in real terms (Figure 18a). However, once again note that the actual health spending by individuals was still below the 10-year trend before the pandemic (2008–09 to 2018–19, Figure 18b).

In 2020–21, individuals spent an estimate of $11.4 billion (34.4%) on medications not subsidised through the PBS, including over-the-counter medications, vitamins and health-related products. Another $6.5 billion (19.6%) was spent on dental services and $4.7 billion (14.1%) on both referred and unreferred medical services (Table 20).

Individuals’ spending on private hospitals increased by 58.9% compared to 2019–20, most likely due to the gradual easing of COVID-19 restrictions in 2020–21 compared to 2019–20.

Per person individual health spending

Health spending by individuals equated to an average of $1,293 per person in 2020–21.
This was made up of:

  • $445 on non-subsidised medications
  • $253 on dental services
  • $182 on referred and unreferred medical services
  • $149 on hospital services
  • $124 on aids and appliances
  • $58 on health practitioners, such as chiropractors, optometrists, practice nurses and physiotherapists
  • $58 on medications partly subsidised by the PBS (Figure 18a).

This annual per person spending increased by 8.8% in 2020–21 in real terms, $105 more than in 2019–20. This was the year of highest growth over the decade to 2020–21 (note that the high growth followed a decline in 2019–20).

Figure 18a: Average(a) per person individual health expenditure, by area of expenditure, constant prices(b), 2010–11 to 2020–21

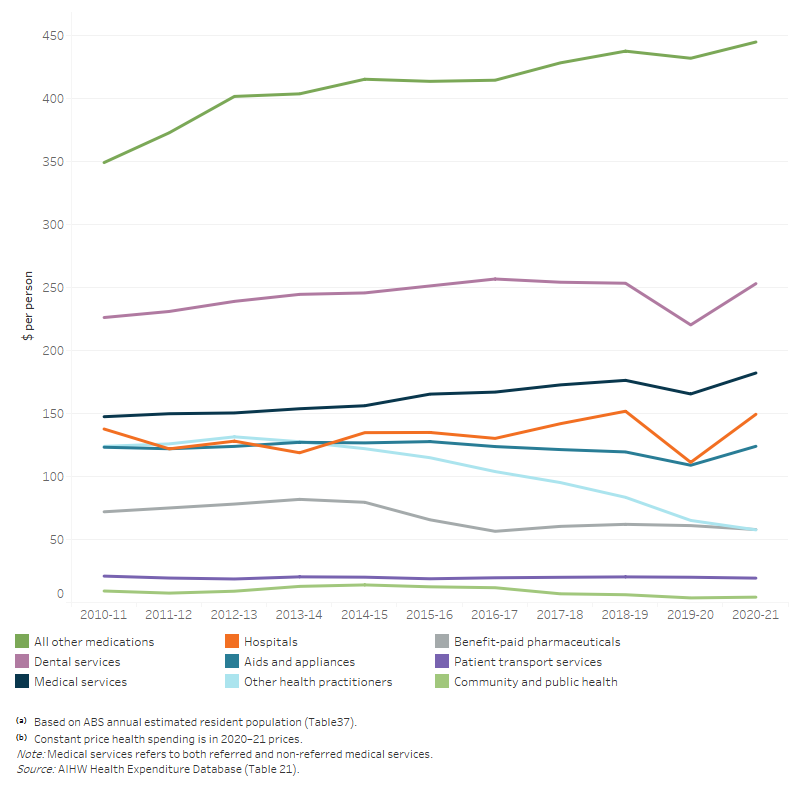
The line graph shows that per person health spending by individuals for hospitals, patient transport services, medical services, dental services, other health practitioners, community and public health, benefit-paid pharmaceuticals, all other medications and aids and appliances from 2010–11 to 2020–21. In 2020–21, per person health spending increased for hospitals, medical services, dental services, all other medications and aids and appliances while decreasing for other areas of spending as compared to 2019–20. Over the 10-year period, per person health spending by individuals on all other medications increased by a relatively larger amount from $349 in 2010–11 to $445 in 2020–21 after a slight decrease in 2019–20. Per person spending by individuals on hospitals steadily increased from $122 in 2011–12 to $149 in 2020–21 after declining to $111 in 2019–20. Per person health spending by individuals on other practitioners increased from $124 in 2010–11 to $132 in 2012–13, and then decreased to $58 in 2020–21.

Figure 18b: Individuals health spending, constant prices, in the 2 years during the COVID-19 pandemic (2019–20 to 2020–21) compared to the trend of the previous 10-year period (2008–09 to 2018–19)

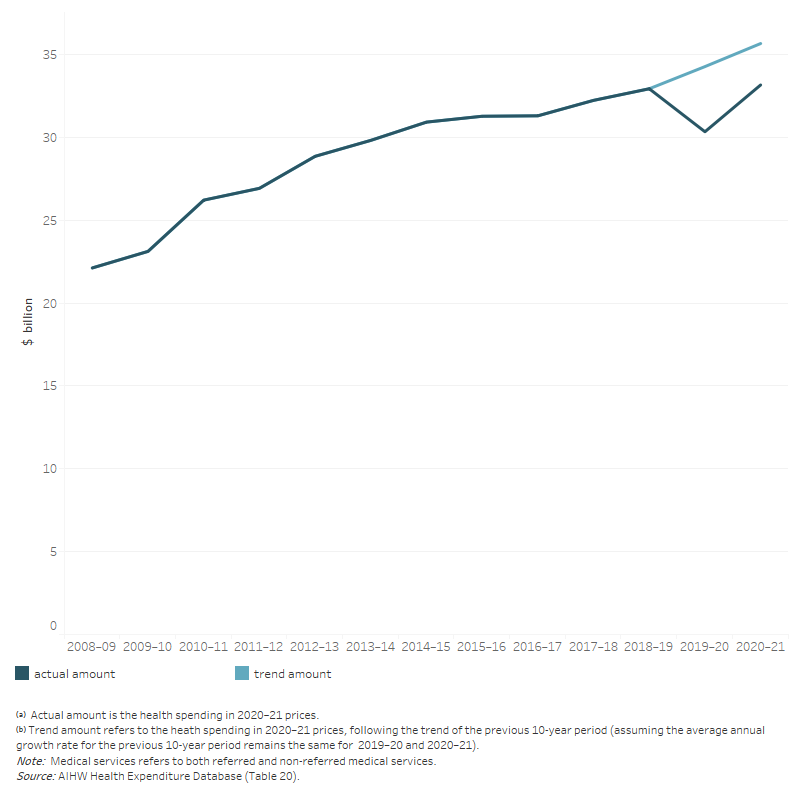
The line graph shows the total individual health spending, in the two years during the COVID-19 pandemic (2019–20 to 2020–21) compared to the trend of the previous 10-year period (2008–09 to 2018–19). Assuming the average growth rate for the previous 10-year period remains the same for 2019–20 and 2020–21, the trend amounts of individuals health spending in constant prices for 2019–20 and 2020–21 were $34.3 billion, $35.6 billion respectively. While the actual amounts for these years were $30.3 billion and $33.2 billion, respectively.

Private health insurance provider spending

During 2020–21, providers of private health insurance financed $18.0 billion (8.2%) of total health spending. More than half ($10.0 billion) was for hospital services, with private hospitals receiving an estimated $9.2 billion. Approximately $3.2 billion was spent on primary health care services (Figure 19).

Spending by health insurance providers increased by 6.2% ($1.0 billion) in 2020–21 in real terms. The real growth rate (6.2%) in 2020–21 was higher than the average over the decade to 2020–21 (4.1%).

Note that the private health insurance spending on referred medical services are related to the gap payment for in-hospital MBS services which currently could not be split to public and private hospitals due to data unavailability.

Figure 19: Private health insurance provider health spending by area of spending, constant prices(a), 2010–11 to 2020–21

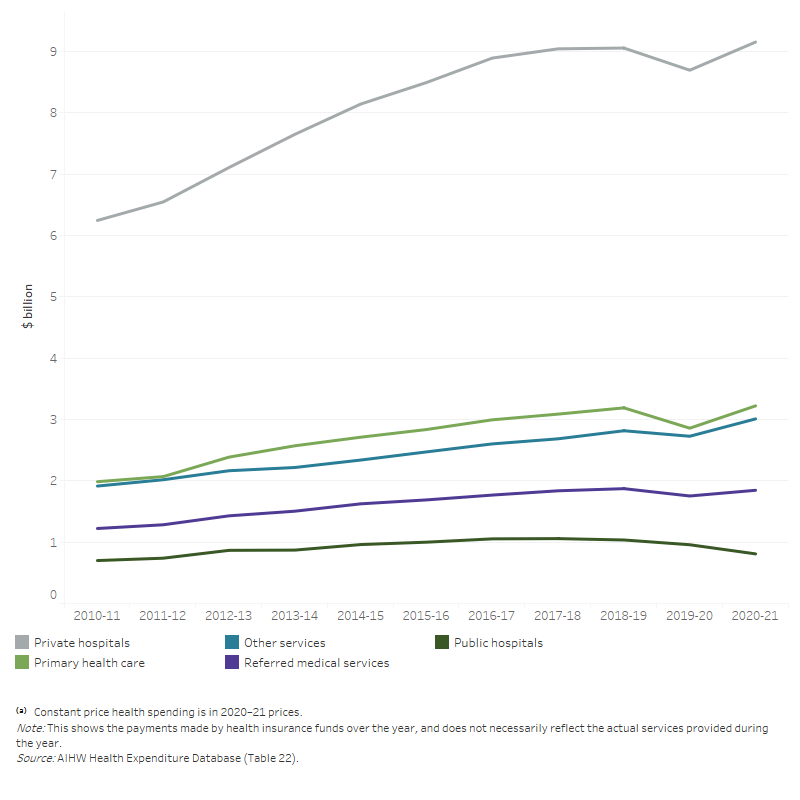
The line graph shows private health insurance provider health spending for public hospitals, private hospitals, primary health care, referred medical services and other services from 2010–11 to 2020–21. During 2019–20 to 2020–21, there was an overall increase in private health insurance provider health spending for most areas of spending except for public hospitals. In 2020–21, private health insurance provider health spending on private hospitals, primary health care, other services, referred medical services and public hospitals were $9.2 billion, $3.2 billion, $3.0 billion, $1.8 billion and $0.8 billion respectively.

Private health insurance provider health spending per person covered

In 2020–21, private health insurance providers spent an estimated average of $1,587 per person covered by a private hospital insurance policy. This was an increase of $73 (4.8%) from 2019–20 in real terms and was higher than the average annual growth of 3.0% per person covered over the decade (Figure 20).

South Australia ($1,791), Queensland ($1,766) and Tasmania ($1,751) had the highest spending by private health insurers per person covered, at more than 1.5 times the amount of the Northern Territory ($950) (Figure 20).

Nationally, spending by private health insurers equated to an average of $704 per person in 2020–21, including those not covered by private health insurance. This represented an increase of 5.7% from 2019–20 in real terms. The average annual growth rate for the decade from 2010–11 was 2.6% (Table 24).

Figure 20: Average per person(a) spending by private health insurance providers for each state and territory, constant prices(b), 2010–11 to 2020–21

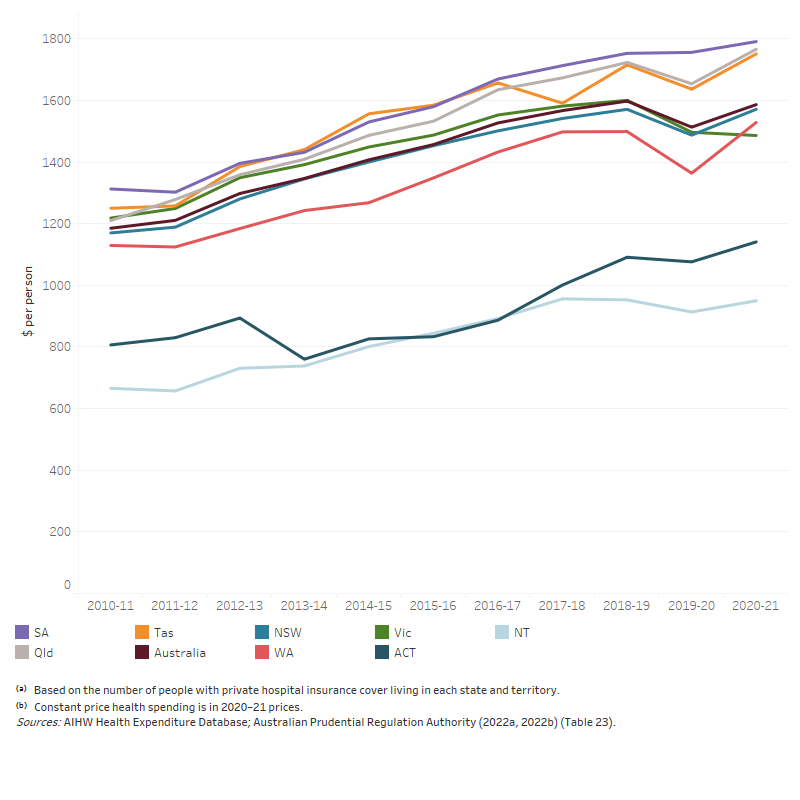
The line graph shows that average per person spending by private health insurance providers for all states and territories and Australia from 2010–11 to 2020–21. Between 2019–20 to 2020–21, average per person spending for all state and territories and Australia as the whole nation increased steadily except for Victoria. In 2020–21, average per person spending by private health insurance providers in New South Wales, Victoria, Queensland, Western Australia, South Australia, Tasmania and Australia as the whole nation was around $1,587. At the same time, average per person spending by private health insurance providers was $1,141 for the Australian Capital Territory and $950 for the Northern territory.

Other non-government spending

In 2020–21, other non‑government sources spent $13.7 billion on health, representing 6.2% of total health spending in the year (Table 10). This presented a slight increase of 0.3% compared with 2019–20, lower than the average annual growth rate over the decade (4.3%).

During 2020–21, injury compensation insurers spent $3.6 billion on health goods and services: $2.3 billion by workers’ compensation insurers and $1.3 billion by compulsory third‑party motor vehicle insurers (Table 25).

Individuals health spending relative to income and wealth

To better understand how health spending is impacting the disposable or readily accessible wealth of people (the ‘out-of-pocket costs’), health spending by individuals is compared with both average incomes and measures of net worth to understand whether, on average across the population, individuals’ health spending is rising relative to personal wealth over time. Note that these are average figures, so the analysis here does not take into account inequality issues in income, wealth, and individuals’ health spending.

In 2020–21, health spending by individuals amounted to an average of $1,293 per person, 1.9% of average annual income, a slight increase from 2019–20 (1.8%) (Figure 21). On average over the decade, individual health spending increased by an 2.2% per year compared to 2.5% per year for the average annual income (in current prices).

Figure 21: Ratio of average individual health spending (a) to average annual income (b), current prices, 2010–11 to 2020–21

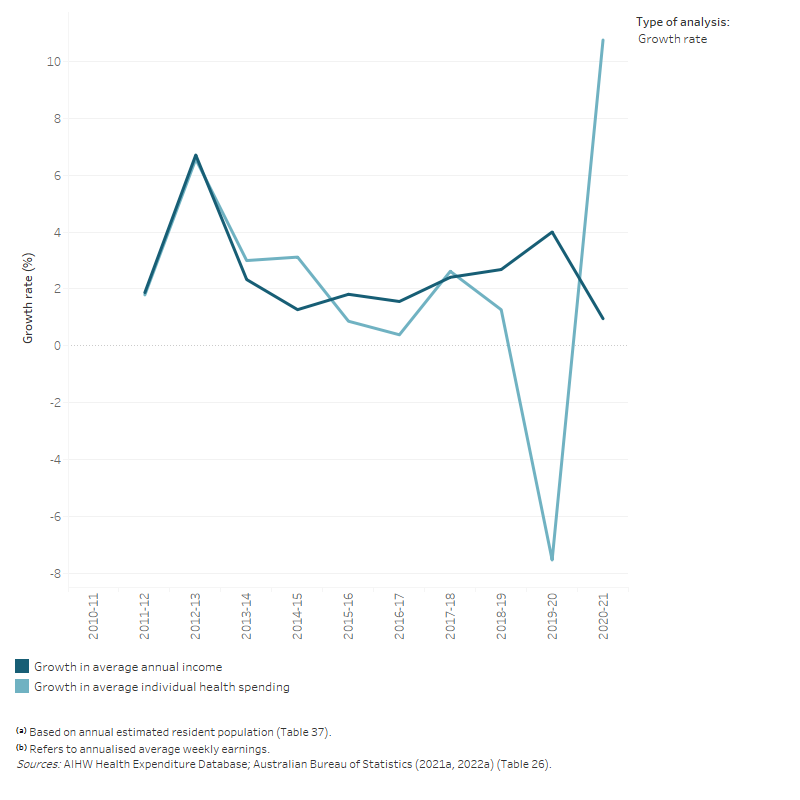
The line graph shows that annual growth rate in average individual health spending was positive for all years between 2010–11 and 2020–21 except in 2019–20. In the 10- year period, annual growth rate in average individual health spending ranged from –7.5 per cent to 10.8 per cent. Growth rates in average annual income was positive each year in the 10- year period and ranged between 1.0 per cent and 6.7 per cent. The ratio between average individual health spending per person and average annual income was relatively flat with an average of 2.0 per cent.

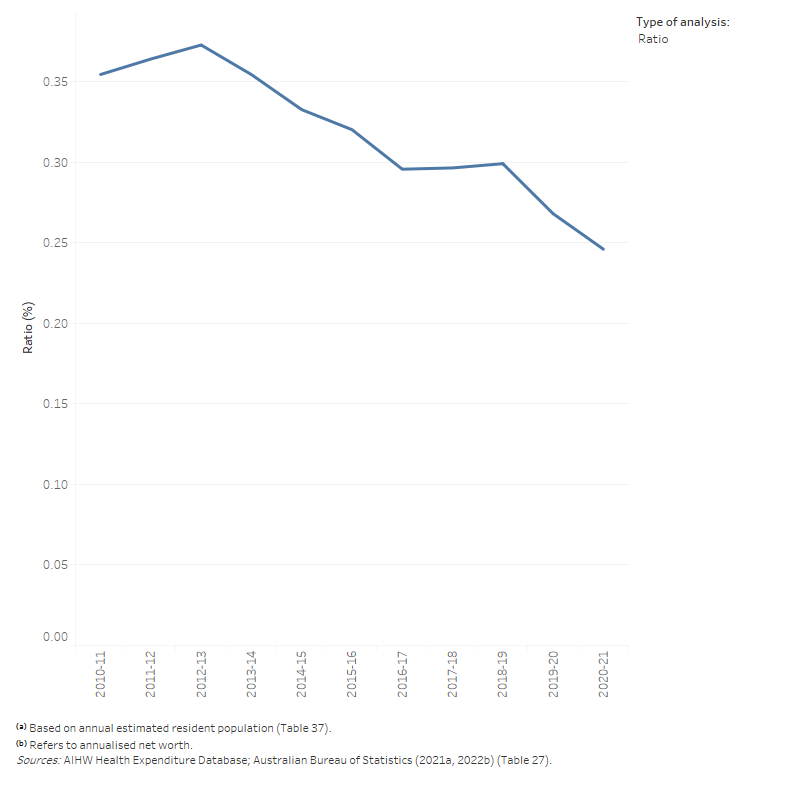
The line graph shows that both the growth rates in individual net worth and average individual health spending fluctuated between 2010–11 and 2020–21. Annual growth rate in individual net worth was lowest at –0.9 per cent in 2011–12 before reaching its maximum rate at 20.7 per cent in 2020–21. Meanwhile, annual growth rate in average individual health spending was lowest in 2019–20 at –7.5 per cent and highest in 2020–21 at 10.8 per cent. The ratio between per person health spending by individuals and individual net worth was relatively flat with an average of 0.3 per cent.

About measures of individual income and wealth

To estimate how individuals’ health spending has compared with the financial resources available to individuals, 2 measures are considered:

  1. income is used to provide a sense of how health spending compared with average earnings throughout the year – how much was spent on health compared with how much earnt in that year
  2. net worth is used to provide a sense of how health spending compared with the overall wealth position of individuals in a given year, providing a more long-term sense of how health spending compared with personal wealth, particularly where health costs may be too high to be met by regular income.