Injury spending by patient characteristics
Patterns of injury expenditure by both nature and cause of injury vary across different population groups including age, sex, geographical location and Indigenous status, due to the likelihood of injury and types of injuries experienced.
Age and sex
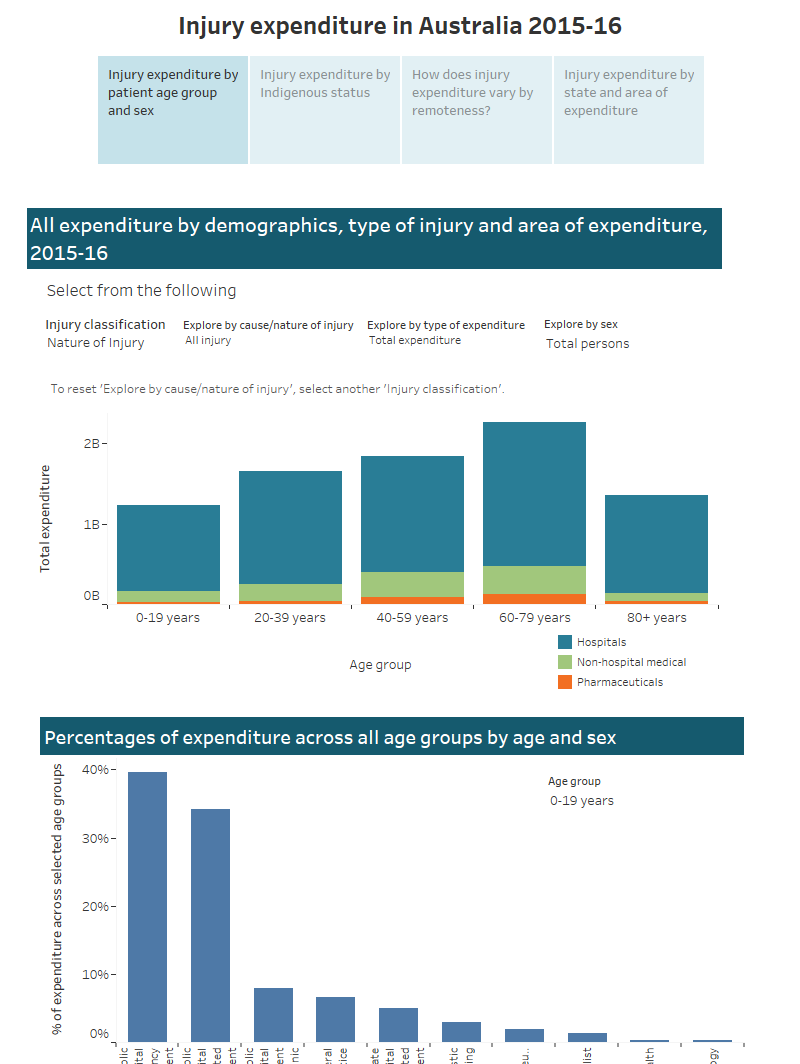
The overall spending on injury-related services was slightly higher for males ($4.3 billion) than females ($4.1 billion) in 2015–16. There are different profiles in terms of spending on the various service types across age groups. Generally, injury-related spending was higher for males than females in younger age groups and for the older age groups the spending for females was higher than males.
Total spending was highest in the 60-79 years age group for both females ($1.2 billion, or 28%) and males ($1.1 billion, or 26%), followed by the 40-59 years age group ($984 million for males and $863 million for females).
Per person spending on injuries was higher for males ($363) than females ($337). Among males, this increased from $241 per person in the 0-19 age group up to $1,347 for males aged 80+. Among females, spending on injuries was $172 per person in the 0-19 age group, increasing to $1,559 for those aged 80+.
For females, the 80+ age group had the highest level of spending per person for all service types except diagnostic imaging and specialists. For males, the 25-64 age group had the highest level of spending per person for all service types.
Injuries related to Falls was the highest area of injury-related spending, accounting for 41 per cent of total spending. Spending on Falls was higher for females ($2 billion) than males ($1.5 billion) and this spending is associated with increasing age for both sexes. The highest level of spending was seen in the 80+ age group for females (36%) and 60-79 years for males (33%). For both sexes and all age groups, the highest spending was for public hospital admitted patient services followed by public hospital emergency services. Spending per person on Falls for those aged 80 + was $1,301 for females, and $944 for males.
Indigenous status
The analysis undertaken for this report allows injury-related spending for Indigenous Australians to be reported for hospital-related services. In 2015–16, injury-related spending in hospitals was $337 million (4.4%) for Indigenous Australians and $7.3 billion (95.6%) for non-Indigenous Australians. Considering per person injury-related spending on hospital-related services, Indigenous spending at $397 per person was higher than non-Indigenous spending at $292.
There was a difference in the profile of injury-related spending across the difference hospital-related services for Indigenous and non-Indigenous patients. About 65 per cent of spending on hospital-related services for Indigenous patients was for public hospital admitted patient services compared with 55 per cent for non-Indigenous patients. About 2 cent of spending for Indigenous patients was for private hospital services compared with 19 per cent for non-Indigenous patients.
On a per person basis, $231 was spent on public hospital admitted patient services, $112 on emergency departments, $44 on public hospital outpatient clinics, and $10 on private hospital admitted patient services for Indigenous Australians. For non-Indigenous Australians per person spending is $135, $63, $35, and $59 respectively.
Overall there was little difference between Indigenous and non-Indigenous Australians in the level of per person spending across different types of injuries, by cause or nature. Non-Indigenous Australians had higher spending on Falls (43% compared to 28%), while Indigenous Australians had higher spending on Other unintentional injuries (31% compared to 24%).
Geographical location
Injury expenditure in Major cities accounted for the largest share of total allocated expenditure ($5.3 billion). Regional areas (inner and outer regional) accounted for $2.4 billion, followed by remote areas (remote and very remote) at $204 million. On a per person basis however, spending was higher for remote areas, with $418 spent per person, compared to $323 in major cities, and $388 in regional areas.
Differences in per person spending was greatest for admitted patients in public hospitals, where $238 was spent for patients living in remote areas, and $122 for patients living in major cities . Other areas of expenditure generally had similar spending per person between major cities and regional areas, while spending on non-hospital medical services was lower in remote areas compared to both major cities and regional areas.
Spending on injuries was highest in New South Wales (30% of total injury spending), Victoria (25%) and Queensland (23%). Per person spending is highest in states with a higher proportion of the population living rurally. Spending was highest in the Northern Territory at $423 per person, Queensland ($421) and Western Australia ($388). This pattern holds for most causes of injury, except falls and pedestrians injured in road traffic accidents.


