Atrial fibrillation as a principal diagnosis
On this page
In 2017–18, there were over 72,000 hospitalisations in Australia with AF as a principal diagnosis (the diagnosis largely responsible for hospitalisation). This represents an age-standardised rate of 248 hospitalisations per 100,000 population.
Hospitalisatons with AF as prinicipal diagnosis accounted for 0.7% of all hospitalisations, and 12% of all CVD hospitalisations in 2017–18. The average length of stay for hospitalisations with the principal diagnosis of AF was 2.4 bed-days, with 37% of AF hospitalisations discharged on the same day.
Age and sex
In 2017–18, AF hospitalisation rates as the principal diagnosis were:
- 1.5 times as high for males as for females (298 and 199 per 100,000 population)
- Higher among older age groups—the rate for persons aged 85 and over was almost 4 times as high as for the 55–64 year age group (1,804 and 477 per 100,000 population)
- Higher for males than females to age 65–74, similar at age 75–84, and higher for females than males at age 85 and over, reflecting the later onset of CVD and elevated risk of AF for older females (Figure 1).
Figure 1: Atrial fibrillation hospitalisation rates, principal diagnosis, by age and sex, 2017–18
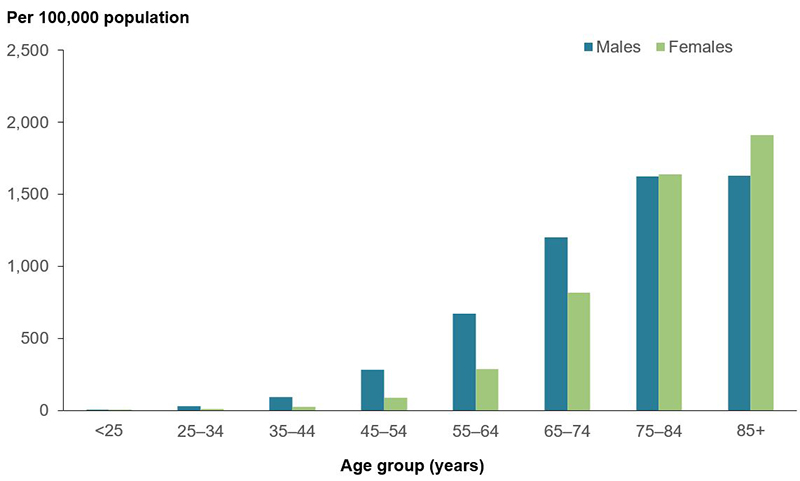
Source: AIHW National Hospital Morbidity Database. (Data table 1)
Trends
Between 2000–01 and 2017–18, the age-standardised rate of hospitalisations with a principal diagnosis of AF:
- increased by 42%, from 175 to 248 hospitalisations per 100,000 population
- rose from 209 to 298 per 100,000 population for males, and from 142 to 199 per 100,000 population for females (Figure 2).
There was also a relative increase in AF hospitalisations, from 0.5% of all hospitalisation and 8% of CVD hospitalisations in 2000–01, to 0.7% of all hospitalisations and 12% of CVD hospitalisations in 2017–18.
Figure 2: Atrial fibrillation hospitalisation rates, principal diagnosis, by sex, 2000–01 to 2017–18
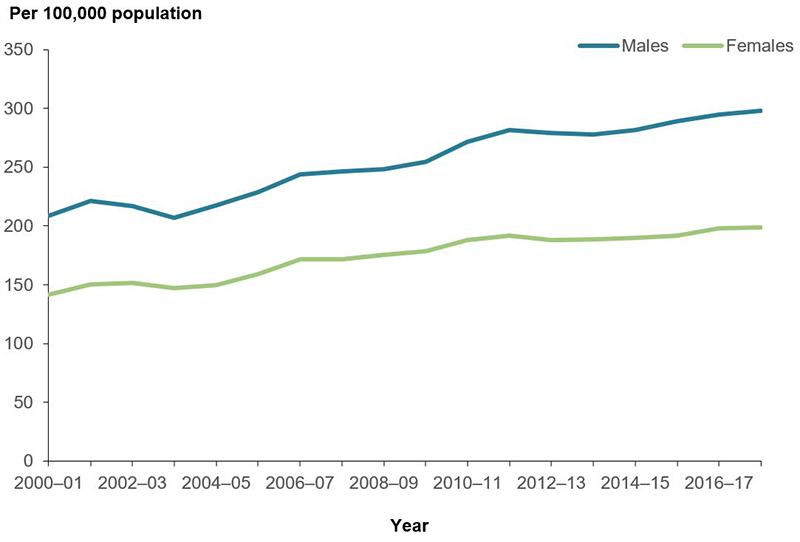
Note: Age-standardised to the 2001 Australian population.
Source: AIHW National Hospital Morbidity Database. (Data table 3)
Given the rates of population ageing, hospitalisations for other CVDs and changes in rates of AF procedures, hospitalisations for AF rose at a greater rate than expected (Gallagher et al. 2019; Wong et al. 2012). The use of linked hospitalisations data in Western Australia has shown that the increase in that state was driven more by repeat hospitalisations for the same person, rather than new hospitalisations (Briffa et al. 2016; Weber et al. 2019).
Population groups
Aboriginal and Torres Strait Islander people
In 2017–18, there were 1,100 hospitalisations of Aboriginal and Torres Strait Islander people where AF was the principal diagnosis, at a rate of 139 hospitalisations per 100,000 population.
After adjusting for differences in the age structures between the populations, the rate of hospitalisations where AF was the principal diagnosis was similar for Indigenous and non-Indigenous males (273 and 292 per 100,000 population), but higher for Indigenous females compared with non-Indigenous females (241 and 195 per 100,000 population) (Figure 3).
Remoteness and socioeconomic position
In 2017–18, hospitalisation rates where AF was the principal diagnosis were:
- similar among socioeconomic groups (245 and 249 per 100,000 population in the lowest and highest socioeconomic groups), based on area of usual residence
- similar across remoteness areas (240 per 100,000 population in Major cities and 278 per 100,000 population in Remote and very remote areas) (Figure 3).
Figure 3: Atrial fibrillation hospitalisation rates, principal diagnosis, by sex and population group, 2017–18
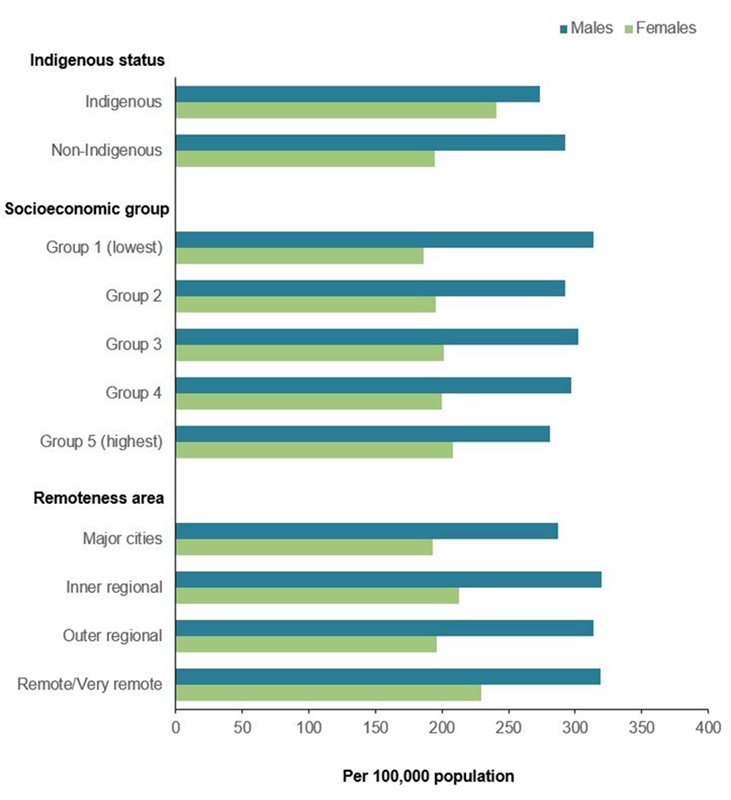
Note: Age-standardised to the 2001 Australian population.
Source: AIHW National Hospital Morbidity Database. (Data table 5)
Primary Health Networks
A Primary Health Network (PHN) is an independent primary health care organisation established to commission health services to meet the identified and prioritised needs of people in their region, as well as work collaboratively within their regions to integrate health services at the local level to create a better experience for patients, encourage better use of health resources, and eliminate service duplication. In 2017–18, the age-standardised rate of hospitalisation for AF as a principal diagnosis varied across the 31 Australian PHN regions, ranging from 153 to 353 per 100,000 population (Data table 8).
The age-standardised rate was 2.3 times as high in the PHN region with the highest rate (Northern Territory) compared with the PHN region with the lowest rate (South Western Sydney).
For further analysis of geographic variations in AF hospitalisations by states/territories and by smaller local areas (Statistical Areas Level 3 (SA3s)), refer to ACSQHC (2017).