Stroke

Page highlights:

How many Australians have had a stroke?

  • In 2018, an estimated 387,000 Australians aged 15 and over (1.6% of the population) had experienced a stroke at some time in their lives.

Stroke events

  • In 2020, there were an estimated 39,500 stroke events in Australia – more than 100 every day.

Hospitalisations 

  • There were around 67,900 hospitalisations where stroke was recorded as the principal diagnosis in 2021–20.

Deaths

  • In 2021, stroke was the underlying cause of 8,500 deaths (4.9% of all deaths and 20% of cardiovascular disease deaths).

What is stroke?

Stroke occurs when a blood vessel supplying blood to the brain either suddenly becomes blocked (ischaemic stroke) or ruptures and begins to bleed (haemorrhagic stroke).

Either may result in part of the brain dying, leading to impairment that can affect a range of activities such as speaking, thinking, movement and communication. Stroke is often fatal.

A condition related to stroke is transient ischaemic attack (TIA). TIA occurs when the blood supply to the brain is blocked temporarily. The signs are the same as for a stroke, but they disappear within a short time, and there is no evidence of damage on brain imaging. TIA is an important predictor of stroke.

Risk factors for stroke include tobacco smoking, high blood pressure, abnormal blood lipids, TIA, atrial fibrillation, diabetes and other heart disease.

Stroke is sometimes referred to as cerebrovascular disease, although cerebrovascular disease is a broader category of diseases which include stroke and other disorders of the blood vessels supplying the brain or its covering membranes. Stroke is the most common form of cerebrovascular disease.

How many Australians have had a stroke?

In 2018, an estimated 387,000 Australians aged 15 and over (1.6% of the population) had experienced a stroke at some time in their lives, based on self-reported data from the ABS Survey of Disability, Ageing and Carers (ABS 2019).

Age and sex

The prevalence of stroke was:

  • higher in males (1.6%) than females (1.1%), after adjusting for differences in the age structure of the populations
  • more common in older age groups – over 2 in 3 (71%) people who had a stroke were aged 65 and over. Proportions were highest for those aged 85 and over – almost 3 times as high as for those aged 65–74 (Figure 1).

Figure 1: Prevalence of self-reported stroke among persons aged 15 and over, by age and sex, 2018

The bar chart shows the prevalence of self-reported stroke by age group in 2018. Rates were highest among men and women aged 85 and over (16.0% and 12.3%).

Variation among population groups

Aboriginal and Torres Strait Islander people

Limited national information on the occurrence of stroke is available for the Indigenous population, with under-identification in hospital and death data and small case numbers often hampering accurate estimates (Katzenellenbogen et al. 2011). However, studies in a number of jurisdictions have found rates to be higher than for the non-Indigenous population, including:

  • a first-ever stroke incidence rate of 116 per 100,000 population in South Australia in 2009–2011 – 1.7 times as high as for the non-Indigenous population (Balabanski et al. 2018)
  • a first-ever stroke incidence rate of 307 per 100,000 population in the Northern Territory in 1999–2011 – 2.2 times as high as for the non-Indigenous population (You et al. 2015)
  • stroke incidence rates of 377 for Indigenous males and 341 for Indigenous females in Western Australia in 1997–2002 – 2.6 and 3.0 times as high as for the non-Indigenous population (Katzenellenbogen et al. 2011).

Socioeconomic area

Based on the 2018 Survey of Disability, Ageing and Carers, the age-standardised prevalence of stroke among people aged 15 and over living in the lowest socioeconomic areas (1.8%) was more than twice as high than for those than in the highest areas (0.8%).

Remoteness area

Based on the 2018 Survey of Disability, Ageing and Carers, for both men and women, there were no statistically significant differences in the age-standardised prevalence of stroke across remoteness areas (Figure 2).

Figure 2: Prevalence of self-reported stroke among persons aged 15 and over, by population group and sex, 2018

The horizontal bar chart shows that the prevalence of self-reported stroke in 2017–18 was higher among people living in socioeconomically disadvantaged areas, but did not vary significantly by remoteness areas.

Stroke events

There are no direct national data sources on the annual number of strokes. However, a related measure can be used as an estimate – the number of stroke events – developed by the AIHW using unlinked hospital and deaths data (AIHW 2022).

The number of stroke events includes new and recurrent strokes.

In 2020, there were an estimated 39,500 stroke events in Australia – more than 100 every day. The rate of stroke events was 154 per 100,000 population.

Age and sex

In 2020, there were an estimated 21,000 stroke events among males and 18,500 among females.

Rates of stroke events:

  • were 1.4 times as high in males than females, after adjusting for differences in the age structure of the populations.

  • increased with age, with the rate of the 85 and over age group more than twice the rate of the 75–84 year age group, and almost 6 times the rate of the 65–74 year age group (Figure 3).

Figure 3: Stroke events, by age and sex, 2020

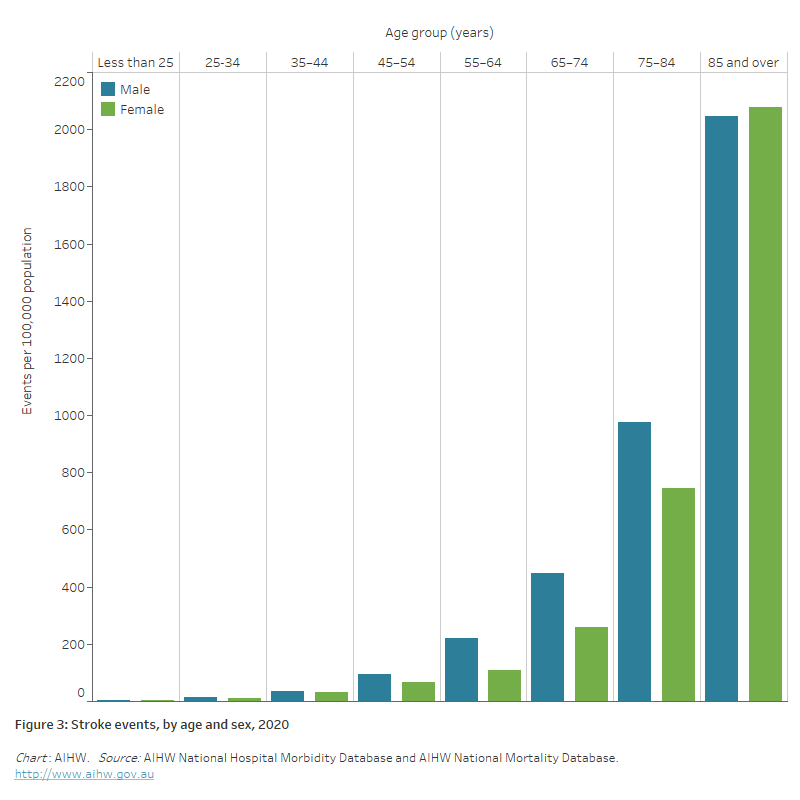
The bar chart shows the prevalence of stroke events by age group in 2020. Rates were highest among men and women aged 85 and over (2,047 and 2,077 per 100,000 population).

Trends

The age-standardised rate of stroke events fell by one quarter (27%) between 2001 and 2020, from 169 to 124 events per 100,000 population.

The decline in rates was slightly greater for females (29%) than males (26%) (Figure 4). 

Figure 4: Stroke events, by sex, 2001–2020

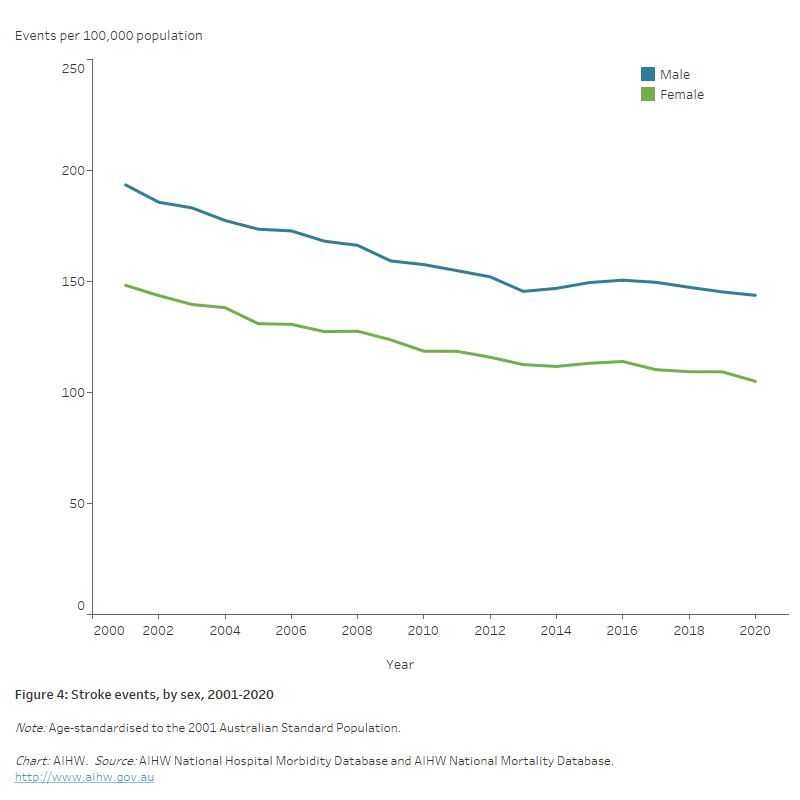
The line chart shows the decline in age-standardised rates of stroke events between 2001 and 2020, from 194 to 144 per 100,000 population for males and 148 to 105 for females.

Transient ischaemic attack

Transient ischemic attack (TIA) is a condition related to stroke. It is a temporary blockage of the blood supply to the brain, often lasting only a few minutes, and producing stroke-like symptoms that disappear within a short time.

Unlike stroke, there is no permanent damage to the brain, with no remaining symptoms, and no evidence of damage on brain imaging. TIA is, however, an important predictor of stroke – after a TIA, the risk of stroke is much higher (Stroke Foundation 2021).

  • In 2020–21 there were 19,700 presentations to public hospital emergency departments with a principal diagnosis of TIA – two-thirds (13,000 or 66%) were subsequently admitted to hospital.

  • There were 17,000 admissions to hospital with a principal diagnosis of TIA – a rate of 66 per 100,000 population. Male rates were higher than female rates (age-standardised rates of 58 and 49 per 100,000 population).

  • Around 4.9% (837) of TIA admissions had an additional diagnosis of atrial fibrillation.

  • One quarter (4,500 or 27%) of TIA admissions were on a same-day basis. The average length of stay in hospital for all TIA admissions was 2.8 days.

Hospitalisations

There were around 67,900 hospitalisations where stroke was recorded as the principal diagnosis in 2020–21 – a rate of 265 per 100,000 population.

This represents 0.6% of all hospitalisations, and 11% of all cardiovascular disease (CVD) hospitalisations in Australia.

Of these, 41,300 (61%) required acute care, and 26,600 (39%) were for rehabilitation and other types of care.

Age and sex

In 2020–21, where stroke was recorded as the principal diagnosis, hospitalisation rates:

  • were 1.4 times as high for males than females, after adjusting for differences in the age structure of the populations
  • increased with age, with rates for males and females highest in those aged 85 and over – around 1.6 times as high as males aged 75–84 and 2.0 times as high as females aged 75–84 (Figure 5)
  • half (50%) of all stroke hospitalisations occurred among persons aged 75 and over.

Figure 5: Stroke hospitalisation rates, principal diagnosis, by age and sex, 2020–21

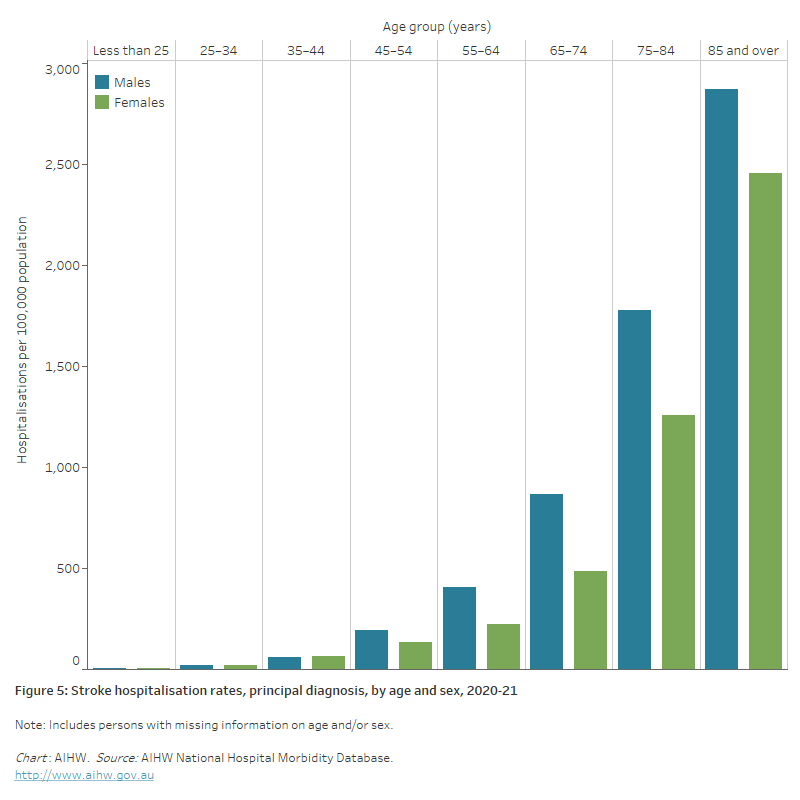
The bar chart shows stroke hospitalisation rates by age groups in 2020–21. Rates were highest among men and women aged 85 and over (2,900 and 2,500 per 100,000 population).

Trends

  • Between 2000–01 and 2020–21, the number of acute care stroke hospitalisations increased by 41% for males, and 16% for females.
  • The age-standardised rate of hospitalisation for acute care stroke fell by 23%, from 170 to 130 per 100,000 population. Rates fell by 22% for males and 26% for females (Figure 6).

Figure 6: Acute care stroke hospitalisation rates, principal diagnosis, by sex, 2000–01 to 2020–21

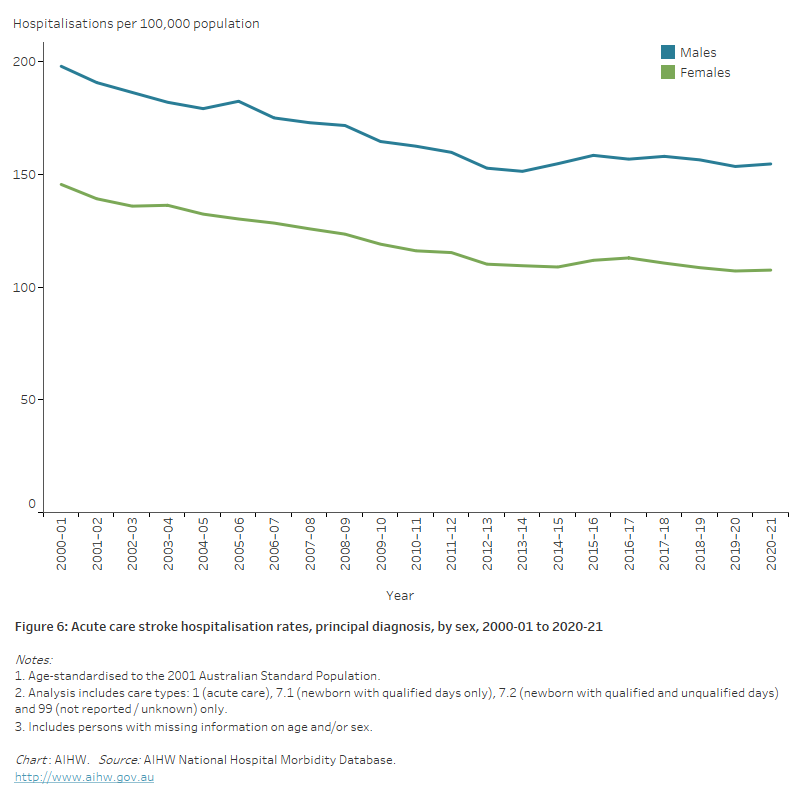
The line chart shows the decline in age-standardised rates of acute care stroke hospitalisations between 2000–01 and 2020–21, from 197 to 155 per 100,000 population for males, and from 145 to 108 for females.

Variation among population groups

Aboriginal and Torres Strait Islander people

In 2020–21, there were around 1,600 hospitalisations with a principal diagnosis of stroke among Aboriginal and Torres Strait Islander people – a rate of 186 per 100,000 population.

After adjusting for differences in the age structure of the populations:

  • the rate among Indigenous Australians was 1.7 times as high as the non-Indigenous rate
  • the disparity between Indigenous and non-Indigenous Australians was greater for females than males – 2.2 times as high for females and 1.4 times as high for males (Figure 7).

Socioeconomic area

In 2020–21, age-standardised stroke hospitalisation rates for people living in the lowest and highest socioeconomic areas were similar (Figure 7).

Remoteness area

In 2020–21, age-standardised stroke hospitalisation rates for people living in Remote and very remote areas were 1.2 times as high as for people living in Major cities (Figure 7).

Figure 7: Stroke hospitalisation rates, principal diagnosis, by population group and sex, 2020–21

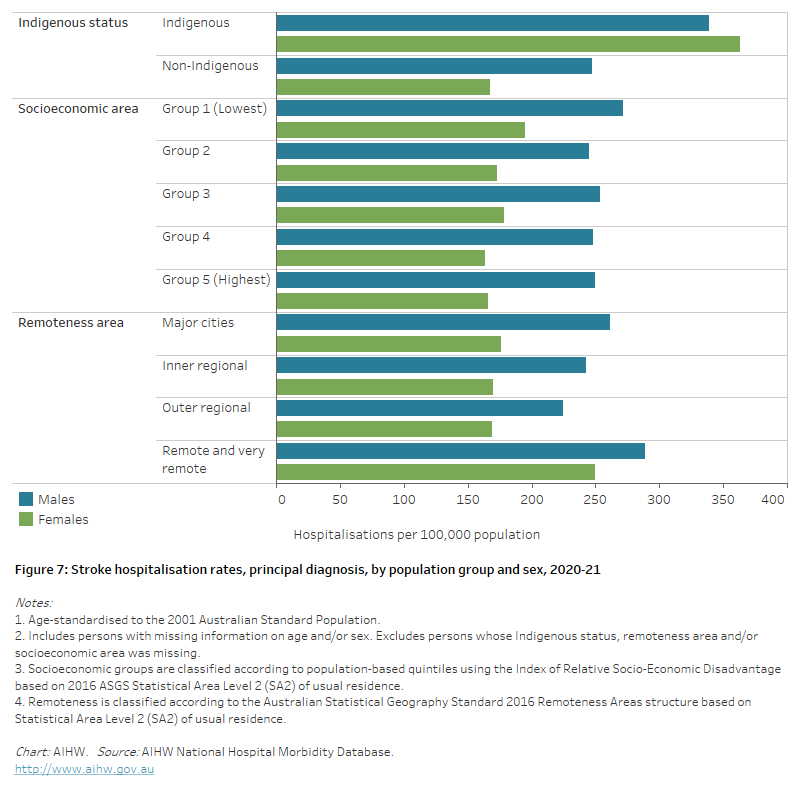
The horizontal bar chart shows that stroke hospitalisation rates in 2020–21 were higher among Indigenous Australians, people living in the lowest socioeconomic areas, and people living in remote and very remote areas.

Deaths

In 2021, stroke was the underlying cause of 8,500 deaths (4.9% of all deaths and 20% of CVD deaths) – a rate of 33 per 100,000 population.

Stroke was one of the 5 leading causes of death in Australia – on average, 23 Australians died of stroke each day in 2021.

Age and sex

In 2021, stroke death rates:

  • were similar for males and females after adjusting for differences in the age structure of the populations
  • were higher for males than females in most age groups – in age 85 and over rates were higher among females than males (913 and 736 per 100,000 population)
  • increased with age, with over half (53%) of all stroke deaths occurring in those aged 85 and over, where stroke death rates were 4 times as high for males and 6 times as high for females aged 75–84 (Figure 8).


Figure 8: Stroke death rates, by age and sex, 2021

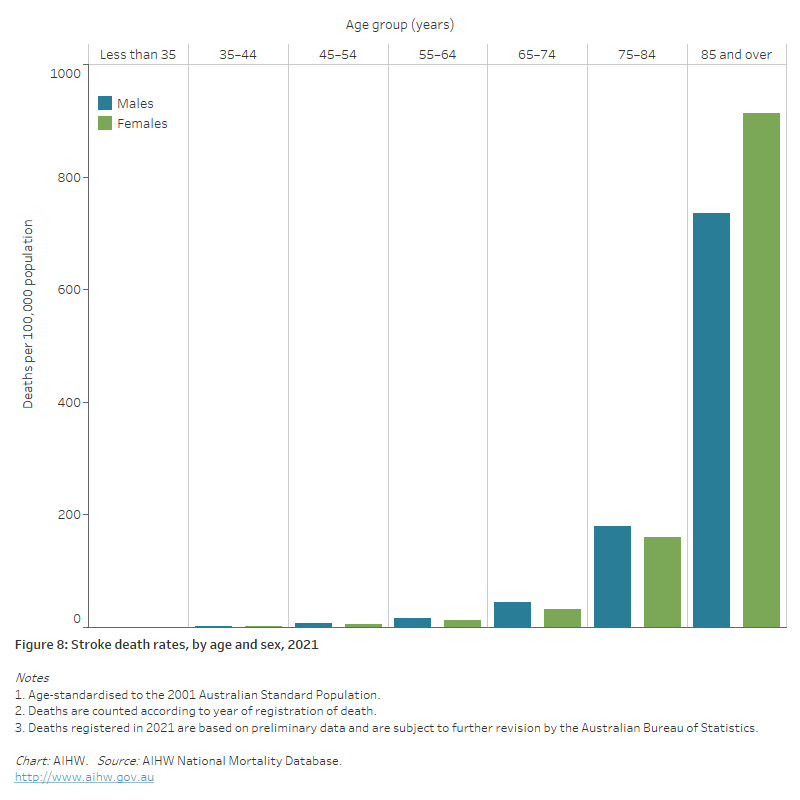
The bar chart shows stroke death rates by age groups in 2021. Rates were highest among men and women aged 85 and over (736 and 913 per 100,000 population).

Trends

The number and rate of stroke deaths declined substantially between 1980 and 2021:

  • the number of stroke deaths declined by 16%, from around 10,000 to 8,500
  • the age-standardised stroke death rate declined by three-quarters (77%), falling from 104 to 24 deaths per 100,000 population. Stroke death rates declined in a similar fashion for males and females (Figure 9).

Falling stroke death rates have been driven by a number of factors, including improvements in risk factors such as lower rates of tobacco smoking, an increased use of blood pressure–lowering drugs, treatment to prevent blood clots, access to stroke units in hospitals and other advances in medical care (AIHW 2013).

Figure 9: Stroke death rates, by sex, 1980–2021

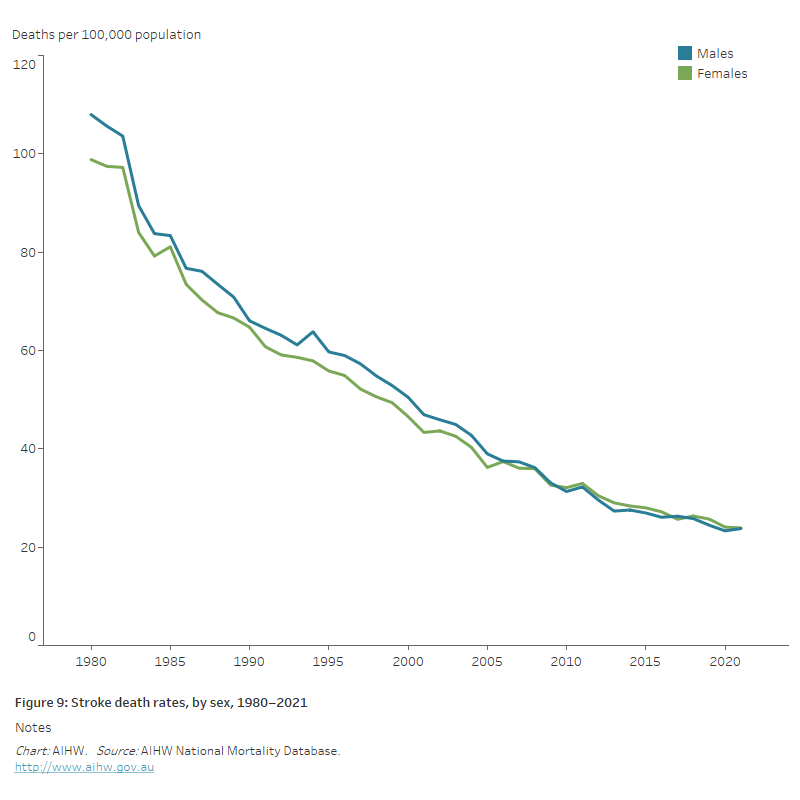
The line chart shows the decline in age-standardised coronary heart disease death rates between 1980 and 2021, from 108 to 24 per 100,000 population for males and from 99 to 24 for females.

Provisional mortality data

Australian Bureau of Statistics (ABS) provisional mortality statistics indicate that there were 9,100 doctor-certified deaths due to cerebrovascular diseases (including stroke) during 2020, rising to 9,300 in 2021 and 9,300 in 2022 (ABS 2023).

The increase in cerebrovascular disease deaths reverses a historical decline, with the number of deaths in 2022 being 2.2% higher than in 2020.

Note that these data are preliminary, with some deaths that occurred in 2022 not yet registered. In addition, causes of death were not presented for coroner-referred deaths due to the time required to complete coronial investigations (ABS 2023).

Variation among population groups

Aboriginal and Torres Strait Islander people

In 2019–2021:

  • there were 353 deaths with an underlying cause of stroke among Aboriginal and Torres Strait Islander people in jurisdictions with adequate identification of Indigenous status, a rate of 15 per 100,000 population.
  • after adjusting for differences in the age structure of the populations, the stroke death rate for Indigenous people was 1.6 times as high as that for non-Indigenous people .
  • Indigenous males and females had stroke death rates 1.5 and 1.7 times as high as non-Indigenous males and females (Figure 10).

Socioeconomic area

In 2019–2021, the stroke death rate was 1.3 times as high for people living in the lowest socioeconomic areas compared with those living in the highest socioeconomic areas, after adjusting for differences in the age structure of the populations.

The difference was similar for males (1.4 times as high) and females (1.3 times as high) (Figure 10).

Remoteness area

In 2019–2021, the stroke death rate in Remote and very remote areas was 1.1 times as high as in Major cities, after adjusting for differences in the age structure of the populations.

The female rate in Remote and very remote areas was 1.2 times as high as in Major cities, and the male rate 1.1 times as high (Figure 10).

Figure 10: Stroke death rates, by population group and sex, 2019–2021

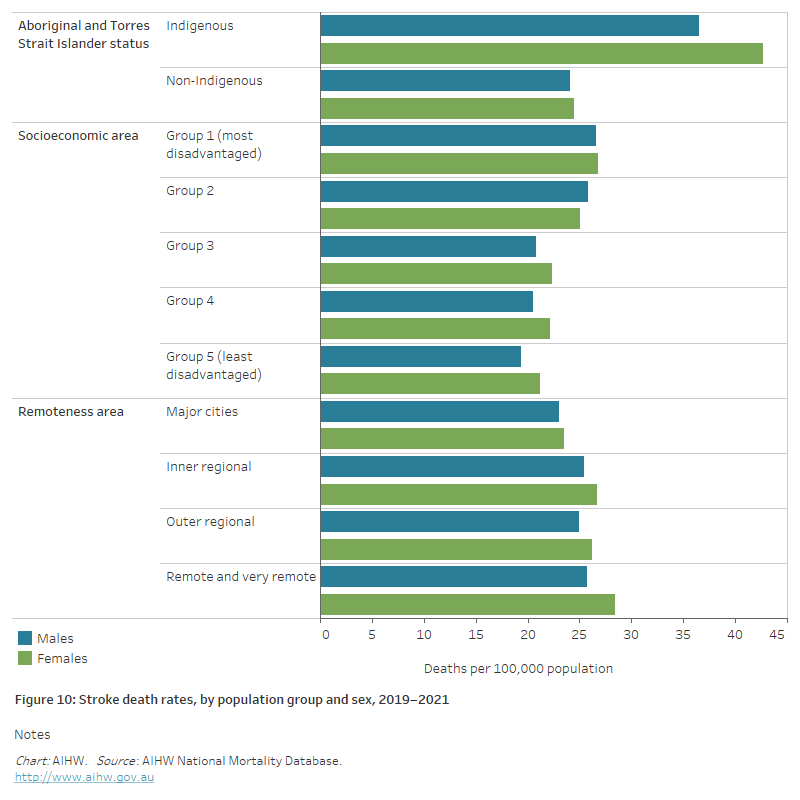
The horizontal bar chart shows that stroke death rates in 2019–2021 were higher among Indigenous Australians and people living in the lowest socioeconomic areas, but did not differ significantly by remoteness area.