Burden of cardiovascular disease
Page highlights:
- In 2023, cardiovascular disease accounted for almost 12% of the total burden of disease (14% males, 10% females), ranking fourth as a disease group behind cancer, mental and substance use disorders and musculoskeletal conditions.
- Coronary heart disease was the leading single cause of burden for males, and sixth leading single cause for females in 2023.
Cardiovascular disease accounted for 10% of total burden in First Nations people in 2018.
- The leading risk factor contributing to the total cardiovascular disease burden in 2018 was high blood pressure (36%).
What is burden of disease?
Burden of disease is a measure of the years of healthy life lost from living with, or dying from disease and injury.
The measure used is the ‘disability adjusted life year’ (DALY). This combines health loss from living with illness and injury (non-fatal burden, or YLD) and dying prematurely (fatal burden, or YLL) to estimate total health loss (total burden, or DALY).
Burden of disease estimates seek to capture both the quantity and health-related quality of life, and to reflect the magnitude, severity and impact of disease and injury within a population. Burden of disease does not quantify the social or financial consequences of disease and injury.
Further information can be found in Australian Burden of Disease Study 2023.
Note: The ABDS 2023 does not include estimates by Remoteness areas, Socioeconomic groups or risk factors. The most recent estimates are presented in the Australian Burden of Disease Study: Impact and causes of illness and death in Australia 2018 and Australian Burden of Disease 2018: Interactive data on risk factor burden reports.
In 2023, Australians lost an estimated 666,000 years of healthy life (DALY) due to all forms of cardiovascular disease (CVD), equivalent to 25.1 per 1,000 population.
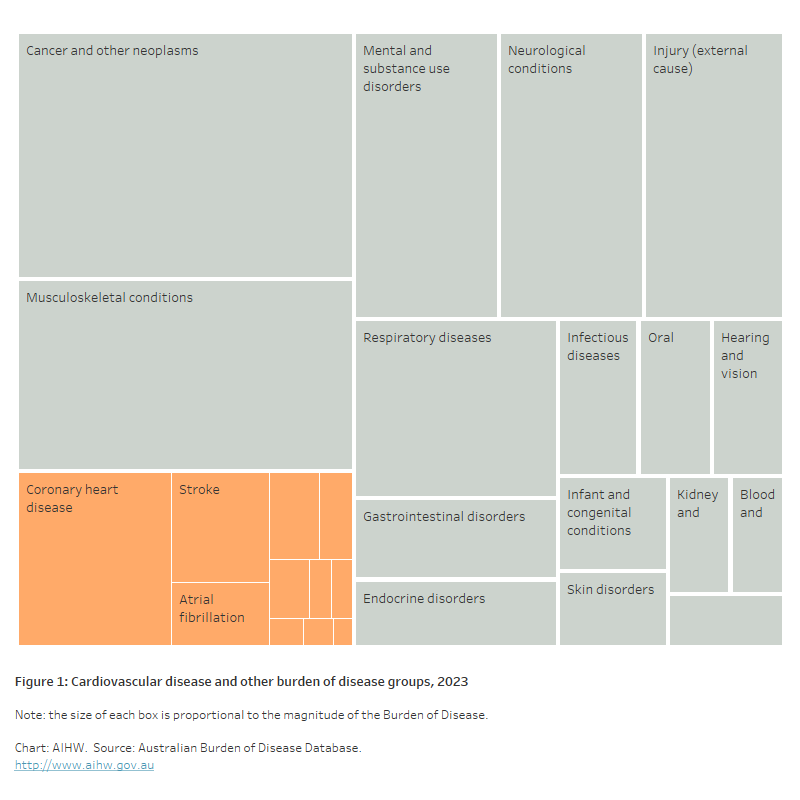
CVD as a disease group accounted for almost 12% of the total burden of disease (14% males, 10% females), ranking fourth behind cancer, mental and substance use disorders and musculoskeletal conditions (Figure 1) (AIHW 2023).
Most of the burden from CVD (74%) came from years of life lost to premature death (YLL), with the remainder (26%) from years lived with illness and injury (YLD).
Figure 1: Cardiovascular disease and other burden of disease groups, 2023
The tree map shows the contribution of the major disease groups to the total burden of disease in Australia in 2023. CVD ranks fourth behind cancer, mental and substance use disorders and musculoskeletal conditions. Within the CVD disease group, coronary heart disease and stroke represent the major contributors to disease burden.
Age and sex
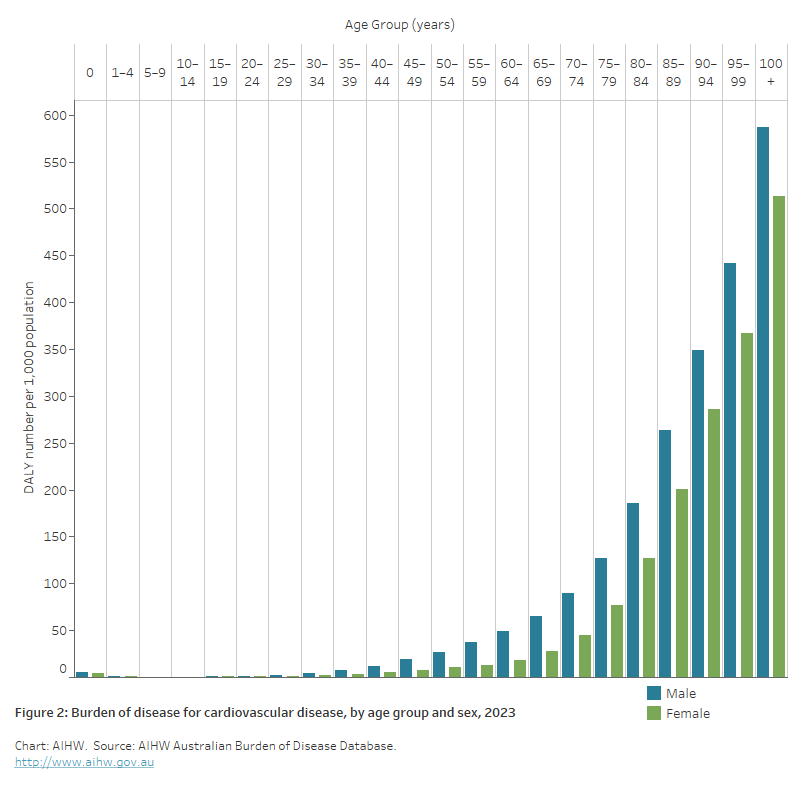
In 2023, the burden from CVD:
- for males was 1.8 times as high as for females
- was low in childhood and increased with age. CVD was the major cause of burden of disease in older Australians aged 75 and over
- was higher for males than females at all ages (Figure 2).
Figure 2: Burden of disease for cardiovascular disease, by age group and sex, 2023
The bar chart shows the burden of disease for cardiovascular disease in 2023 increased with age, and was higher among males than females in all age groups.
Population groups
In 2018, the burden from CVD:
- for people living in the lowest socioeconomic areas was 1.8 times as high as for the highest areas – 42% of DALY in the lowest socioeconomic areas could have been avoided if the burden was the same as the highest areas (AIHW 2021)
- in Remote and very remote areas was 1.9 times as high as in Major cities – 49% of DALY in Remote and very remote areas could have been avoided if the burden was the same as in Major cities.
Trends
- The rate of burden from CVD fell by 47% between 2003 and 2023 – after adjusting for age.
- The fall in the rate of burden from CHD between 2003 and 2023 (58%) was similar to the fall in the rate of burden from stroke (53%).
- The 12% fall in the number of DALY from CVD between 2003 and 2018 (–90,000 DALY) was driven largely by reduction in disease prevalence and/or severity (-374, 000 DALY), which offset increases attributed to population growth (+168,700 DALY) and population ageing (+115,100 DALY) (AIHW 2021).
Leading causes
Leading causes contributing to the CVD burden of disease in 2023 include coronary heart disease, stroke and atrial fibrillation (Figure 1) (AIHW 2023).
Congenital heart disease was a leading contributor to the burden of disease among infants aged less than 1 year.
Coronary heart disease
- 305,000 years of healthy life were lost due to coronary heart disease (CHD) in 2023, equivalent to 11.5 DALY per 1,000 population.
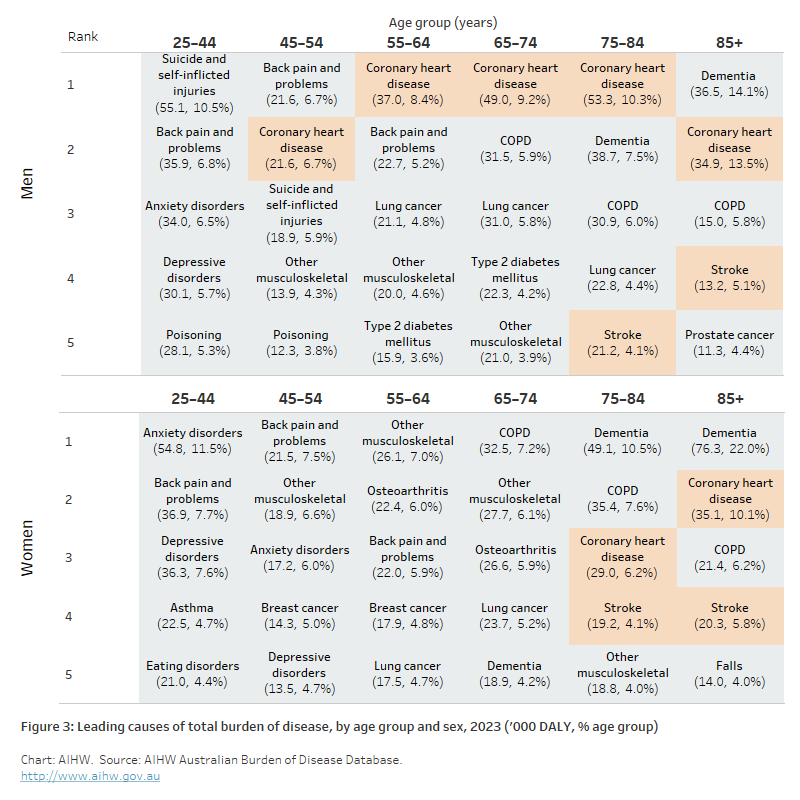
- CHD was the leading single cause of burden for males, and fifth leading cause for females (Figure 3), accounting for 5.4% of the total burden (7.0% for males and 3.7% for females).
- The contribution of CHD to the total burden of CVD was greater in males (52%) than females (37%).
- 80% of the burden from CHD in males and 74% in females was due to premature death (YLL). Years of healthy life lost due to living with disease or injury (YLD) accounted for the remainder – 20% for males and 26% for females.
Stroke
- 124,000 years of healthy life were lost in 2023, equivalent to 4.7 DALY per 1,000 population.
- Stroke ranked 12th in the leading diseases causing burden, accounting for 2.2% of total burden (2.1% males, 2.2% females).
- The contribution of stroke to the total burden of CVD was greater in females (23%) than males (16%).
- 83% of the burden from stroke in males and 87% in females was due to premature death (YLL). Years of healthy life lost due to living with disease or injury (YLD) accounted for the remainder – 17% for males and 13% for females.
Atrial fibrillation
- 71,000 years of healthy life were lost due to atrial fibrillation (AF) in 2023, equivalent to 2.7 DALY per 1,000 population
- AF accounted for 1.3% of total burden (1.3% for males, 1.2% for females)
- The contribution of AF to the total burden of CVD was greater in females (12.4%) than males (9.6%)
- 23% of the burden from AF in males and 33% in females was due to premature death (YLL). Years of healthy life lost due to living with disease or injury (YLD) accounted for the remainder – 77% for males and 67% for females.
Congenital heart disease
- Congenital heart disease is a leading cause of burden of disease among infants aged under 1 year, contributing 7.7% in 2023.
- The burden from congenital heart disease fell by 13% between 2003 and 2023, from 14,800 to 12,800 DALY.
Figure 3: Leading causes of total burden of disease, by age group and sex, 2023 (‘000 DALY, % age group)
The table shows coronary heart disease was the leading cause of total disease burden for males aged 55–84. Coronary heart disease was the second leading cause of disease burden among females aged 85 and over. Stroke was a top 5 cause of disease burden for males and females aged 75–84 and 85 and over.
First Nations people
Burden of disease estimates are available for First Nations people for the year 2018 (AIHW 2022):
- CVD accounted for 10% (25,000 DALY) of total burden in First Nations in 2018 (11% males, 9% females), making it the disease group with the third greatest contribution, behind mental and substance use disorders (23%) and injuries (including suicide) (12%)
- Coronary heart disease accounted for 57% of CVD DALY and stroke 13%. In terms of overall DALY, coronary heart disease caused the most of any disease or injury (5.8% of total DALY) and stroke ranked 20th (1.3% of total DALY)
- 86% of the burden from CVD among First Nations was fatal, and 14% non-fatal. The disease that had the highest proportion due to fatal burden among First Nations was aortic aneurysm (100% fatal, 0% non-fatal)
- the rate of DALY for CVD among First Nations males was 2.2 times that of non-Indigenous males, compared with 2.7 times for First Nations and non-Indigenous females
- CVD was responsible for 14% of the total gap in disease burden between First Nations people and non-Indigenous Australians
- the rate of DALY for rheumatic heart disease among First Nations people was 11 times as high as the rate among non-Indigenous Australians (1.9 and 0.2 DALY per 1,000 population). The rate for CHD was 2.7 times as high (29 and 10 DALY per 1,000 population).
Contribution of risk factors
A portion of burden of disease is preventable, being due to modifiable health risk factors. The Australian Burden of Disease Study 2018 has estimated the disease burden which can be attributed to these modifiable risk factors (AIHW 2021).
Of the total burden of CVD in Australia in 2018, 68% was attributable to the risk factors included in the study.
The leading risk factors contributing to the total CVD burden in 2018 include high blood pressure (36%), dietary risks (31%), overweight (including obesity) (22%), high cholesterol (21%) and tobacco use (11%) (Figure 4).
Note that as each risk factor was analysed separately, percentages cannot be added together, and do not add up to the joint effect of all risk factors.
Figure 4: Proportion of cardiovascular disease DALY attributed to selected risk factors, 2018
The bar chart shows high blood pressure was the leading risk factor attributed to the burden of cardiovascular disease in 2018, followed by dietary risks, overweight and obesity and high cholesterol.

Estimations of the contribution of risk factors varied across cardiovascular conditions (AIHW 2021):
- coronary heart disease – air pollution 8.6%, alcohol use 3.7%, dietary risks 51%, high blood plasma glucose 6.5%, high blood pressure 42%, high cholesterol 37%, impaired kidney function 6.4%, overweight and obesity 28%, physical inactivity 16%, tobacco use 13%.
- stroke – air pollution 8.3%, alcohol use 5.9%, dietary risks 26%, high blood plasma glucose 5.8%, high blood pressure 39%, high cholesterol 16%, impaired kidney function 6.3%, overweight and obesity 24%, physical inactivity 9.2%, tobacco use 11%.
- atrial fibrillation – alcohol use 9.8%, dietary risks 6.0%, high blood pressure 31%, overweight and obesity 29%, tobacco use 7.8%.
AIHW (2021) Australian Burden of Disease Study 2018 – Key findings. Cat. no. BOD 30. Canberra: AIHW.
AIHW (2022) Australian Burden of Disease Study: impact and causes of illness and death in Aboriginal and Torres Strait Islander people 2018. Australian Burden of Disease Study series no. 26, catalogue number BOD 32, AIHW, Australian Government.
AIHW (2023) Australian Burden of Disease Study 2023, AIHW, Australian Government, accessed 14 December 2023.