Rough sleepers
For the purposes of the Specialist Homelessness Services Collection (SHSC), rough sleepers are those with no shelter or who are living in non-conventional accommodation. Non-conventional accommodation includes: living on the streets, sleeping in parks, squatting, staying in cars or railway carriages, living in improvised dwellings or living in the long grass [1].
Who is sleeping rough?
Between 2011–12 and 2014–15, a total of 39,371 clients (9% of all Specialist Homelessness Services (SHS) clients aged 15 years and over) were sleeping rough upon first presentation to SHS. Per year, this ranged from 13,037 in 2011–12 to 15,252 in 2014–15, peaking at 15,683 in 2013–14.
@import url( /WorkArea/DownloadAsset.aspx?id=60129546273 );Typically, rough sleepers are…
male, aged 35 years or over, unemployed, presenting to services alone, located in Major cities and reporting that they have a diagnosed mental health issue.
Overview of cohort characteristics
Table RS.1: Characteristics of rough sleepers and the SHSC client population
| Characteristic | Rough sleepers | SHSC population |
|---|---|---|
| Male | 66% | 39% |
| Aged 35 and over | 53% | 46% |
| Indigenous | 18% | 16% |
| Employed | 6% | 13% |
| Lived in a Major city | 63% | 64% |
| Presented alone | 67% | 36% |
| Reported having experienced domestic and family violence | 18% | 35% |
| Reported a mental health issue | 38% | 28% |
| Diagnosed with a mental health issue | 51% | 22% |
| Had an issue with drugs or substance abuse | 24% | 12% |
Additionally:
- While the proportion of rough sleepers who were male has remained consistent across financial years, the numbers are increasing.
- More than half (53%) were aged 35 and over compared to less than half (46%) of the general SHS population.
- Indigenous Australians were over-represented in both the rough sleeper cohort (18%) and general SHS population (16%) compared with the general Australian population (3%).
- Very few were employed on first presentation (6%) which is lower than the general SHS population (13%).
- While rough sleepers were mostly located in Major cities, 1 in 3 (33%) were located in Inner regional and Outer regional areas. Only 4% were located in Remote and Very remote areas.
- 2 in 3 (67%) presented to SHS agencies alone, compared to more than 1 in 3 (36%) of the general SHS population. Male rough sleepers were more likely to present alone (around 80% compared with around 40% for females), while female rough sleepers were more likely to present with one or more children (33% compared with around 10%).
- Around three times as many female rough sleepers reported ever experiencing domestic and family violence than male rough sleepers (around 35% compared with around 9%).
- Almost 2 in 5 (38%) reported a mental health issue, higher than the SHS population (28%). More than half (51%) reported a diagnosed mental health issue (both slightly higher for men than for women).
- Almost 1 in 4 (24%) reported ever having an issue with drugs or substance abuse: more male than female rough sleepers reported ever having an issue with drugs or substance abuse (27% compared with 16%, respectively).
Reasons for seeking assistance
The most common reasons people sleeping rough sought assistance from SHS were (Figure RS.1):
- accommodation issues: including housing crisis (55%), inadequate or inappropriate dwellings conditions (53%), or prior accommodation ending (35%)
- financial reasons: including financial difficulties (58%), housing affordability stress (29%), unemployment (23%), employment difficulties (11%) or problematic gambling (2%)
- 'other' reasons: including a lack of family and/or community support (27%), itinerant (20%), and 'other' unspecified needs (16%).
Figure RS.1: Reasons for seeking assistance, rough sleepers and all SHS clients, 2011–2015
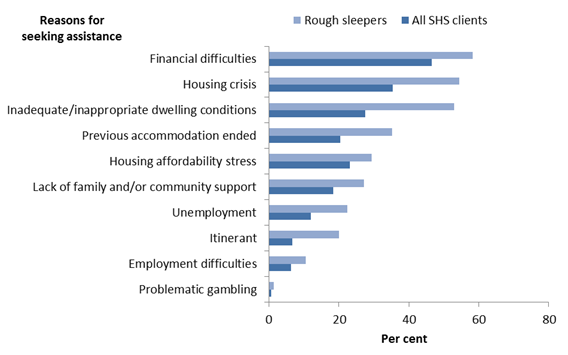
Source: Supplementary data source table.
Rough sleepers were more likely to seek assistance from SHS for accommodation or financial issues than health related issues, but they were still more likely than the SHS client population to seek assistance for health related issues (39% compared with 25%). This was most pronounced for:
- mental health issues (24% of rough sleepers compared with 15% of SHS clients), and
- problematic alcohol use (12% of rough sleepers compared with 5% of SHS clients).
What services do rough sleepers need and what services are provided?
Rough sleepers are most likely to need accommodation services
At the time of presentation to SHS, more than three-quarters (78%) of rough sleepers needed assistance with accommodation, compared with just over half (55%) of all SHS clients (Supplementary data tables RS.12; SHS.1). This need was highest for short-term or emergency accommodation and lowest for medium-term or transitional housing (Figure RS.2).
Figure RS.2: Accommodation services needed, rough sleepers and all SHS clients, 2011–2015
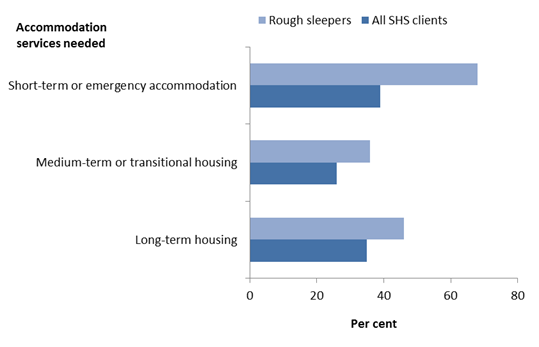
Source: Supplementary data source table.
In general, rough sleepers were slightly more likely to receive assistance with accommodation when compared with all SHS clients (62% compared with 57%, respectively).
While rough sleepers were equally likely to receive short-term or emergency accommodation as SHS clients (both 65%), they were less likely to receive:
- medium-term/transitional housing (20% compared with 30%), or
- long-term housing (5% compared with 8%).
Rough sleepers were also more likely than typical SHS clients to need assistance with general services such as:
- meals (39% rough sleepers, 23% SHS clients)
- laundry/shower facilities (35% rough sleepers, 19% SHS clients)
- recreation (23% rough sleepers, 15% SHS clients)
- transport (29% rough sleepers, 23% SHS clients).
Rough sleepers were just as likely to receive these services as SHS clients, with more than 90% of all clients who needed these services receiving them.
Rough sleepers are less likely to need assistance with interpersonal relationships
Less than half (45%) of rough sleepers when presenting to specialist homelessness services requested assistance with interpersonal relationships compared with more than half (53%) of all SHS clients aged 15 and over.
Specifically rough sleepers were less likely to require assistance with:
- domestic and family violence (10% rough sleepers, 27% of SHS clients), and
- relationship or family breakdown (15% rough sleepers, 19% of SHS clients).
Rough sleepers were also less likely than SHS clients to need assistance with legal services such as:
- legal information (13% rough sleepers, 17% SHS clients), and
- court support (6% rough sleepers, 10% SHS clients).
Housing pathways for rough sleepers
1 in 10 (10%) rough sleepers experienced repeat homelessness between 2011–12 and 2014–15. This means the client had transitioned between being homeless, housed and then homeless again at least once during this time.
The proportions for both males and females have remained consistent across time, but the numbers of males and females sleeping rough and experiencing repeat episodes of homelessness have increased by 6% since 2011.
What are the housing outcomes for rough sleepers?
Almost 2 in 5 (38% or 15,067) clients who first presented to homelessness services as a rough sleeper remained rough sleeping at the end of support. One in 5 (21%) clients presenting as a rough sleeper ended their support 'housed' (12% ended their support in private rental housing and 9% in public or community housing). A further 1 in 5 (17%) transitioned to short-term or emergency accommodation.
Other housing outcomes for rough sleepers who sought assistance from SHS agencies included: couch surfing (5%), and ending support in an institutional setting (2%). Despite support periods being closed, the housing outcome for almost 1 in 5 (17%) rough sleepers was unknown at the end of their support (Figure RS.3).
Figure RS.3: Housing outcomes, rough sleepers, 2011–2015 (per cent)
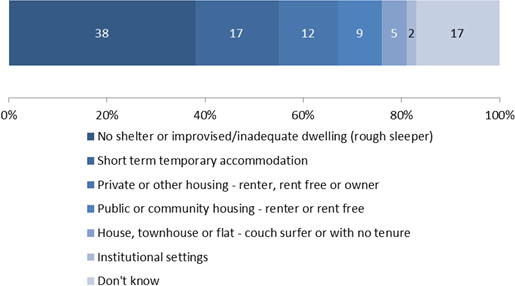
Source: Supplementary data source table.
Compared with the total rough sleeper population, those that ended their support 'housed' were more likely to: be female, have experienced domestic or family violence, have reported experiencing a mental health issue, be located in regional areas, present to services accompanied by children, have experienced more than one episode of homelessness (Table RS.2).
| Characteristic | 'Housed' rough sleepers | Total rough sleeper population |
|---|---|---|
| Female | 45% | 34% |
| Reported having experienced domestic or family violence | 27% | 18% |
| Reported having experienced a mental health issue | 45% | 38% |
| Located in Inner or Outer regional areas | 41% | 33% |
| Presented with one or more children | 30% | 17% |
| Experienced repeated episodes of homelessness | 13% | 10% |
References
- Australian Institute of Health and Welfare (AIHW) 2013. Specialist Homelessness Services Collection manual. Cat. No. HOU 268. Canberra: AIHW.