Clients with problematic drug and/or alcohol use
Key findings: Clients with problematic drug and/or alcohol use, 2020–21
There is a strong association between problematic alcohol or other drug use and experiences of homelessness (AIHW 2021). Problematic drug and/or alcohol use can be a pathway into homelessness or develop while experiencing homelessness (Robinson 2014; Johnson & Chamberlain 2008). It can lock people into homelessness and compound the effects of limited service engagement and increased social isolation. Problematic alcohol or other drug use is related to several homelessness risk factors, including low socioeconomic status and family and domestic violence (Lalor 2020). The Journeys Home project identified that people were more likely to have risky levels of alcohol and drug use, the longer they were homeless (Scutella et al. 2014).
Problematic drug and/or alcohol users are at great risk of serious and preventable health issues and death, particularly those who are homeless (AIHW 2021). They are also likely to have the most persistent and challenging problems (Johnson & Chamberlain 2008; Scutella et al. 2014).
Reporting clients with problematic drug and/or alcohol use in the Specialist Homelessness Services Collection (SHSC)
SHS clients aged 10 and over are considered to have problematic drug and/or alcohol use if, at the beginning of or during support, the client provided any of the following information:
- recorded their dwelling type as rehabilitation facility
- required drug or alcohol counselling
- were formally referred to the SHS agency from an alcohol and drug treatment service
- had been in a rehabilitation facility or institution during the past 12 months
- reported problematic drug, substance or alcohol use as a reason for seeking assistance or the main reason for seeking assistance.
The identification of clients with problematic drug and/or alcohol use may be current or recent; referring to issues at presentation, just prior to receiving support or at least once in the 12 months prior to support.
For more information see Technical notes.
In 2020–21:
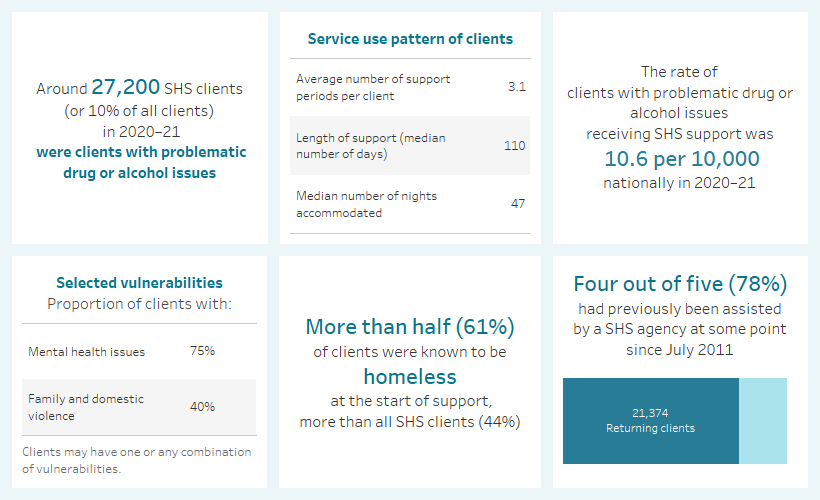
- SHS agencies assisted more than 27,200 clients (aged 10 and over) with problematic drug and/or alcohol use, a decrease from almost 28,500 in 2019–20 (Historical data table HIST.SUB).
- Clients with problematic drug and/or alcohol use represented 9.8% of all SHS clients. (Supplementary table CLIENTS.37).
Client characteristics
Figure SUB.1: Key demographics, clients with problematic drug and/or alcohol use, 2020–21
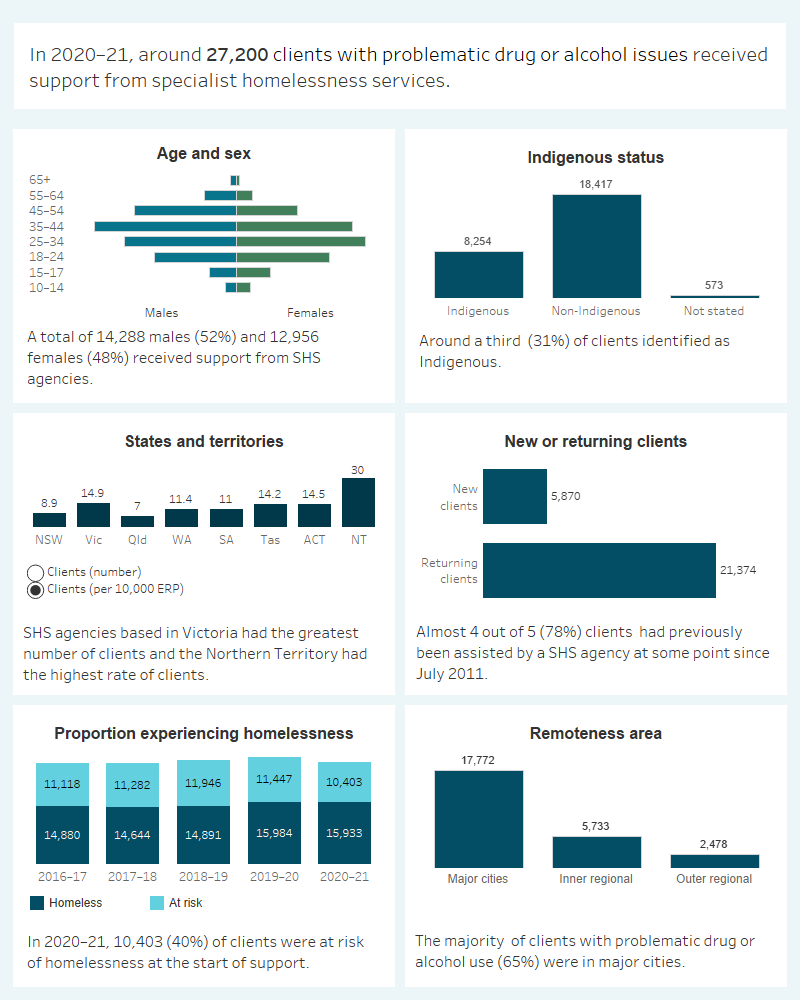
This interactive image describes the characteristics of the approximately 27,200 clients with problematic drug and/or alcohol use and received SHS support in 2020–21. The majority of clients were male, aged 25–44. Nearly a third were Indigenous. Victoria had the greatest number of clients and the Northern Territory had the highest rate of clients per 10,000 population. The majority of clients had previously been assisted by a SHS agency since July 2011. Most were experiencing homelessness at the beginning of support. Most were in major cities.
Presenting unit and Living arrangements
Most clients (87% or over 23,600) with problematic drug and/or alcohol use presented to services for assistance alone, higher than for all SHS clients (63%) (Supplementary tables CLIENTS.9 and CLIENTS.40). A further 8.0% (or more almost 2,200) of clients who were single with one or more children, which was much lower than the rate for all SHS clients (28%).
The living arrangements reported by SHS clients with problematic drug and/or alcohol use at the beginning of support were quite different from the overall SHS population and other client groups. In 2020–21 (Supplementary table CLIENTS.10):
- Almost 60% (or around 15,800) clients with problematic drug and/or alcohol use were living alone at the beginning of SHS support (Supplementary table CLIENTS.41), higher than the proportion for all SHS clients (32%) and other client groups, such as clients with a current mental health issue (47%) and clients with disability (39%).
- Comparatively fewer clients with problematic drug and/or alcohol use were living as one parent with child(ren) (11% or 3,050 compared with 33% of all SHS clients) (Supplementary table CLIENTS.10 and CLIENTS.41).
Selected vulnerabilities
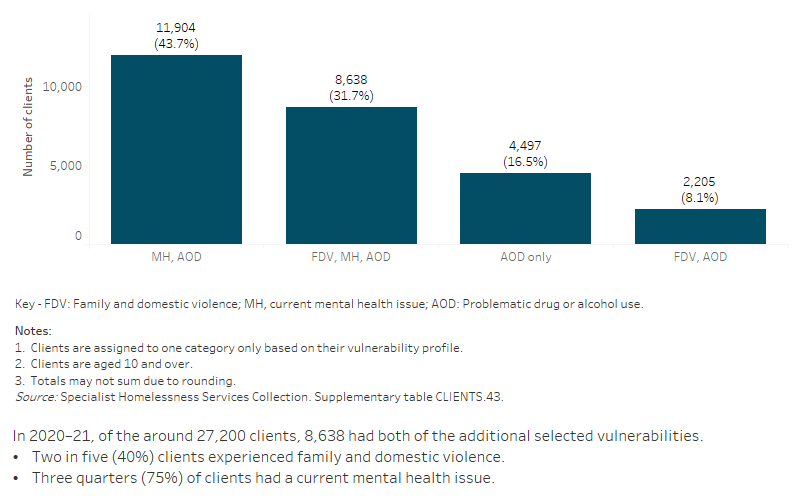
Most clients with problematic drug and/or alcohol use face additional challenges which may make them more vulnerable to homelessness. The selected additional vulnerabilities presented here include family and domestic violence and/or a current mental health issue.
Figure SUB.2: Clients with problematic drug and/or alcohol use, by selected vulnerabilities, 2020–21
Service use patterns
The length of support provided to clients with problematic drug and/or alcohol use increased in 2020–21 to a median of 110 days, up from 83 days in 2016–17. The average number of support periods per client has been relatively consistent over time from an average of 2.9 support periods per client in 2016–17 to 3.1 in 2020–21. The proportion of clients receiving accommodation has increased slightly from 49% in 2016–17 to 52% in 2020–21, while the median number of nights accommodated increased from 40 in 2016–17 to 47 in 2020–21 (Supplementary table CLIENTS.44).
New or returning clients
In 2020–21 (Supplementary table CLIENTS.38):
- Clients with problematic drug and/or alcohol use were more likely to have received SHS services in the past (78% or almost 21,400 clients) than be new clients (22% or almost 5,900). That is, more clients had previously been assisted by a SHS agency at some point since the collection began in July 2011.
- Clients with problematic drug and/or alcohol use were more likely to be returning (78%), compared with other client groups, for example 69% of clients with a mental health issue and 61% of the all SHS clients. This may reflect the cyclical nature of insecure housing among people with problematic drug and/or alcohol use.
Main reasons for seeking assistance
In 2020–21, the main reasons clients with problematic drug and/or alcohol use presented to SHS agencies were (Supplementary tables SUB.4 and CLIENTS.21):
- housing crisis (19%, compared with 18% of the overall SHS population)
- inadequate/inappropriate dwelling conditions (16%, compared with 12%)
- family and domestic violence (13%, compared with 29%).
Few clients (4.3%) with problematic drug and/or alcohol use reported substance use issues as the main reason for seeking SHS assistance.
Services needed and provided
In 2020–21, the top 6 needs reported by SHS clients with problematic drug and/or alcohol use mainly related to housing and tenure (Supplementary table SUB.2).
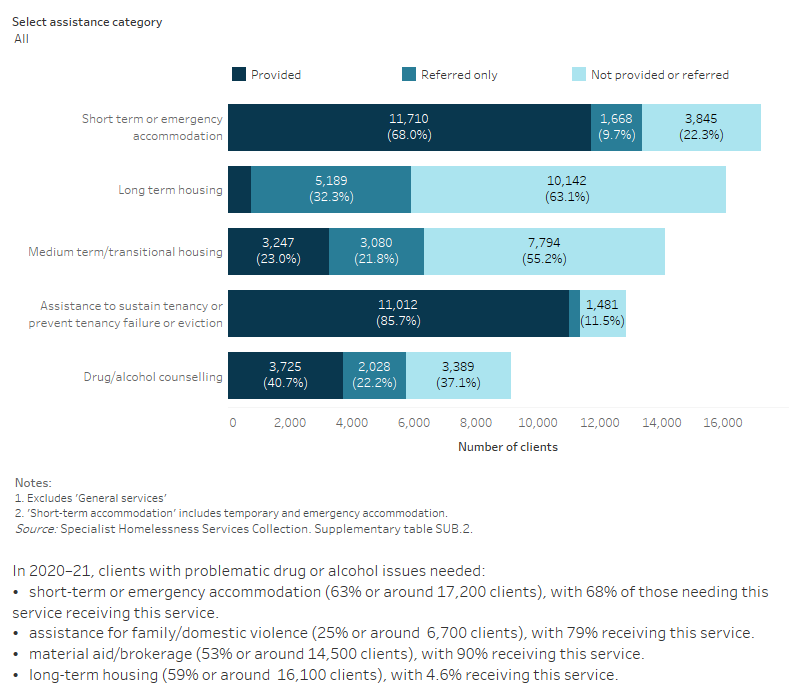
Figure SUB.3: Clients with problematic drug and/or alcohol use, by services needed and provided, 2020–21
This interactive stacked horizontal bar graph shows the services needed by clients with problematic drug and/or alcohol use and their provision status. Short term accommodation was the most needed and most provided service. Long term housing was the least provided service.
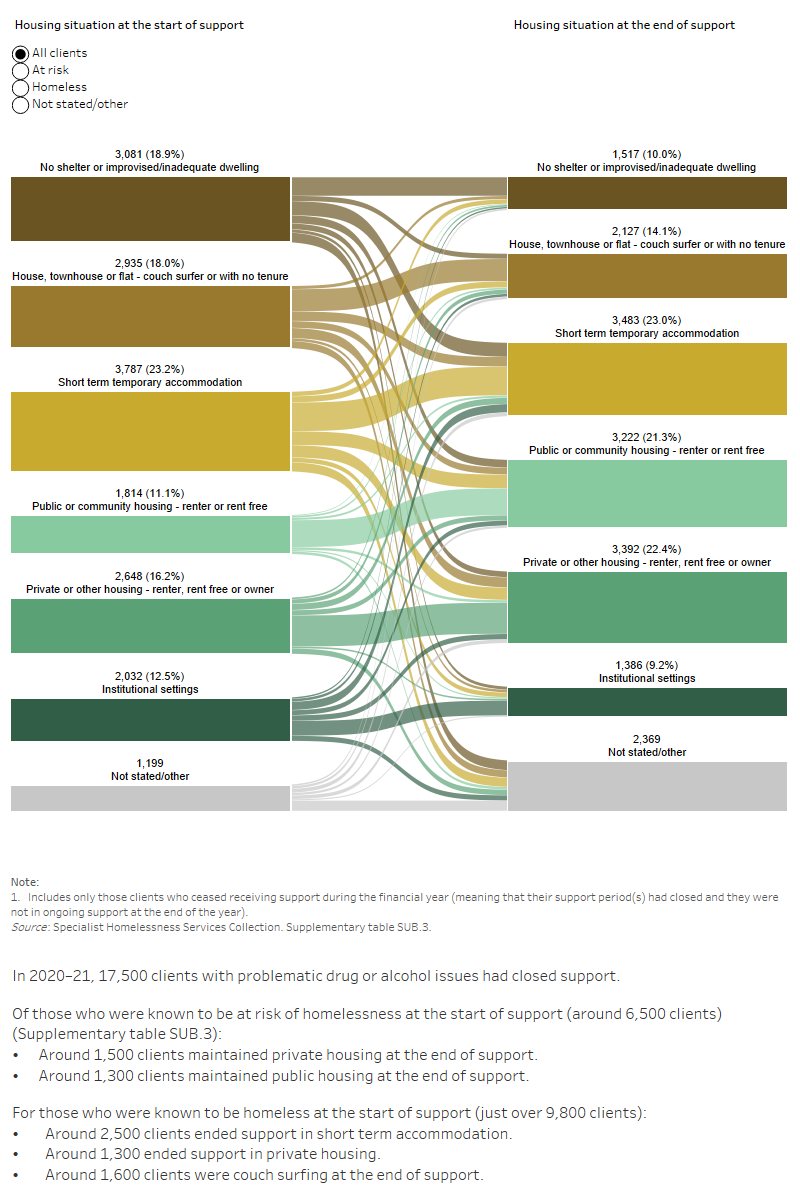
This interactive Sankey diagram shows the housing situation (including rough sleeping, couch surfing, short term accommodation, public/community housing, private housing and Institutional settings) of clients with problematic drug and/or alcohol use with closed support periods at first presentation and at the end of support. The diagram shows clients’ housing situation journey from start to end of support. Most started and ended support experiencing homelessness, in short term accommodation.