Indigenous clients
Key findings: Indigenous SHS clients, 2020–21
Stable and secure housing is critical to the health and well-being of Australians. Aboriginal and Torres Strait Islander people are more likely to experience insecure housing, live in overcrowded dwellings and experience homelessness, including intergenerational homelessness, than non-Indigenous Australians (AIHW 2019). Aboriginal and Torres Strait Islander people make up around 3.1% of the Australian population (ABS 2019) yet they made up around 20% of the estimated number of people experiencing homelessness on Census night in 2016 (ABS 2018) and over a quarter or 28% of the clients (an estimated 73,300 clients) assisted by specialist homelessness services (SHS) in 2020–21.
Severe overcrowding as a form of homelessness is particularly prevalent in Indigenous families and communities. Indigenous Australians are more than three times as likely to live in overcrowded conditions than non-Indigenous Australians (ABS 2016), and more than twice as likely to need one or more extra bedrooms compared to other households (ABS 2017), even though the Census estimates may under represent the extent of homelessness among Indigenous people.
Aboriginal and Torres Strait Islander people are a national priority cohort in the National Housing and Homelessness Agreement, which came into effect 1 July 2018 (CFFR 2018) (see Policy section for more information). This agreement provides a framework for all levels of government to work together to improve housing and homelessness outcomes for Indigenous Australians (AIHW 2019).
Findings from the House of Representatives Standing Committee Inquiry into Homelessness (HRSC 2021) recommended a review of the data collection and estimation methods, recommending greater inclusion of Indigenous Australian cultural practices and perspectives, particularly regarding the circumstances in which persons living in severely crowded dwellings and boarding houses should be categorised as homeless. The findings also highlight the effectiveness and appropriateness of Aboriginal community-controlled housing services, and recommended the development of a national integrated approach to housing and homelessness services for Indigenous Australians, co-designed with Indigenous community-controlled organisations and grounded in the principle of self-determination.
Over 298,200 Indigenous clients have been supported by homelessness agencies since the Specialist Homelessness Services Collection (SHSC) began in July 2011. The number of Indigenous clients has been steadily increasing over this time, most notably (Historical data table HIST.INDIGENOUS):
- The rate of service use by Indigenous clients increased from 755.4 clients per 10,000 Indigenous people in 2016–17 to 810.6 in 2020–21.
- The ratio between the rate of Indigenous SHS clients compared with non-Indigenous clients has also increased, from 8.5 in 2016–17 to 10.1 in 2020–21.
- The total number of Indigenous clients who received support from SHS agencies increased by an average rate of 5.9% annually over the last 10 years to 2020–21, three times faster than for non-Indigenous clients (1.9%) over the same period. During this time the number of ‘not stated’ Indigenous status responses has markedly decreased.
Client characteristics
Figure INDIGENOUS.1: Key demographics, Indigenous SHS clients, 2020–21
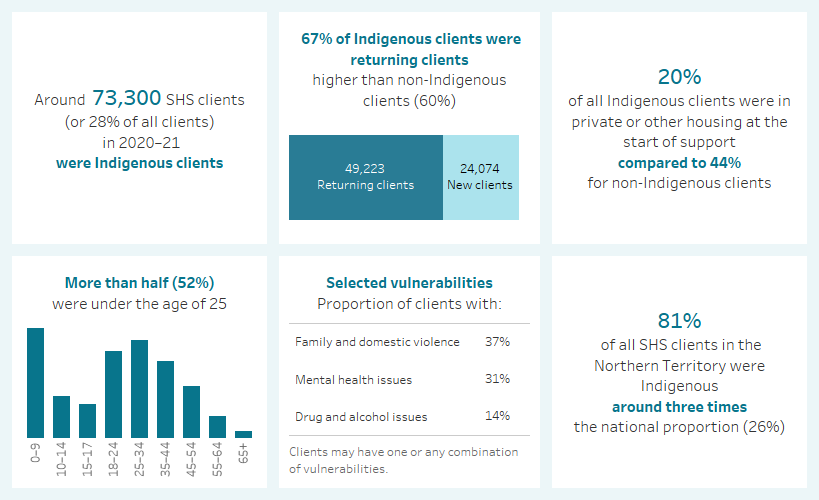
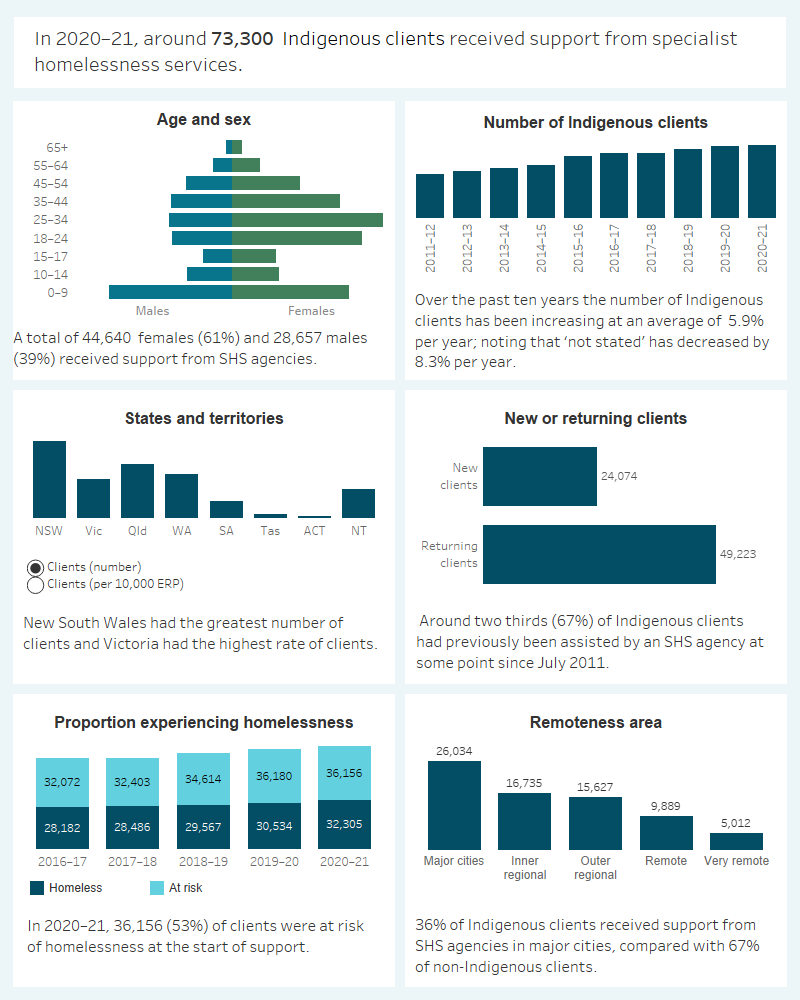
This interactive image describes the characteristics of around 73,300 Indigenous clients who received SHS support in 2020–21. Most clients were female, aged 25–44. The number of Indigenous clients has been increasing, while ‘not stated’ has decreased. New South Wales had the greatest number of Indigenous clients and Victoria had the highest rate of Indigenous clients per 10,000 population. The majority of clients had previously been assisted by a SHS agency since July 2011. More than half were at risk of homelessness at the start of support. A third of Indigenous clients received SHS support in major cities while most non-Indigenous clients received support in major cities.
Presenting unit
In 2020–21, over half of the Indigenous clients presenting to a SHS agency presented alone (56% or almost 41,100 clients) and a further 33% (or almost 24,300 clients) presented as a single parent with child/ren (Supplementary table INDIGENOUS.8).
Living arrangements
In 2020–21, at the beginning of support (Supplementary table INDIGENOUS.9):
- Indigenous clients (33% or about 23,200 clients) were most likely living as a single parent with child(ren)
- 1 in 4 (almost 18,000 or 26%) Indigenous clients were living alone
- A further 18% (or almost 12,800) Indigenous clients were living with other family.
Selected vulnerabilities
SHS clients can face additional vulnerabilities that make them more susceptible to becoming homeless, in particular family and domestic violence, a current mental health issue and problematic drug and/or alcohol use.
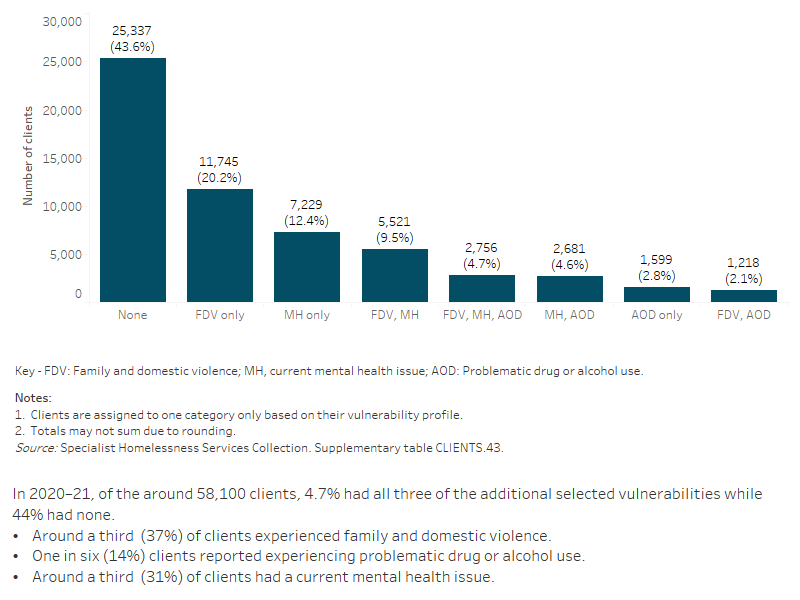
- Less than half (44% or around 25,300) Indigenous clients did not experience any of the selected vulnerabilities which was higher than the rate for all SHS clients (37%).
- While Indigenous clients had a higher rate of reported problematic drug and alcohol use (14% compared to 12% for all SHS clients), a lower rate of Indigenous clients reported experiencing Family and domestic violence (37% compared to 39%), and a significantly lower proportion of Indigenous clients reported experiencing a mental health issue (31% compared to 38%).
Figure INDIGENOUS.2: Indigenous clients, by selected vulnerability characteristics, 2020–21
Service use patterns
The median length of support received by Indigenous clients increased to 55 days in 2020–21, up from 46 days in 2016–17. The average number of support periods per client was 1.8 in 2020–21. The proportion of clients receiving accommodation decreased from 42% in 2016–17 to 41% in 2020–21, while the median number of nights accommodated decreased from 20 in 2016–17 to 16 in 2020–21 (Supplementary table CLIENTS.44).
New or returning clients
In 2020–21, there were more returning Indigenous clients (67%) (that is, those who had received SHS services at some point since the collection began in July 2011) than there were new Indigenous clients (33%) (Supplementary table INDIGENOUS.6). The proportion of returning non-Indigenous clients was lower (60%).
Main reasons for seeking assistance
The three most common main reasons why Indigenous clients sought assistance from SHS agencies in 2020–21 were (Supplementary table INDIGENOUS.7):
- family and domestic violence (25% or 17,800 clients)
- housing crisis (17% or 12,300 clients)
- inadequate or inappropriate dwelling conditions (14% or almost 10,200 clients).
Services needed and provided
In 2020–21, the need for accommodation assistance was broadly similar between Indigenous and non-Indigenous clients, with the exception of short-term or emergency accommodation (Supplementary table INDIGENOUS.3).
Half of Indigenous clients (52% or 37,900) needed short-term or emergency accommodation, higher than the proportion of non-Indigenous clients (37% or 69,900). Two-thirds of Indigenous clients who needed short-term or emergency accommodation received this support (65%); a higher proportion than non-Indigenous clients (58%).
For some general services, needs were higher for Indigenous clients when compared with non-Indigenous clients, including meals (29% compared with 11%), laundry/shower facilities (23% compared with 8%) and transport (25% compared with 13%).
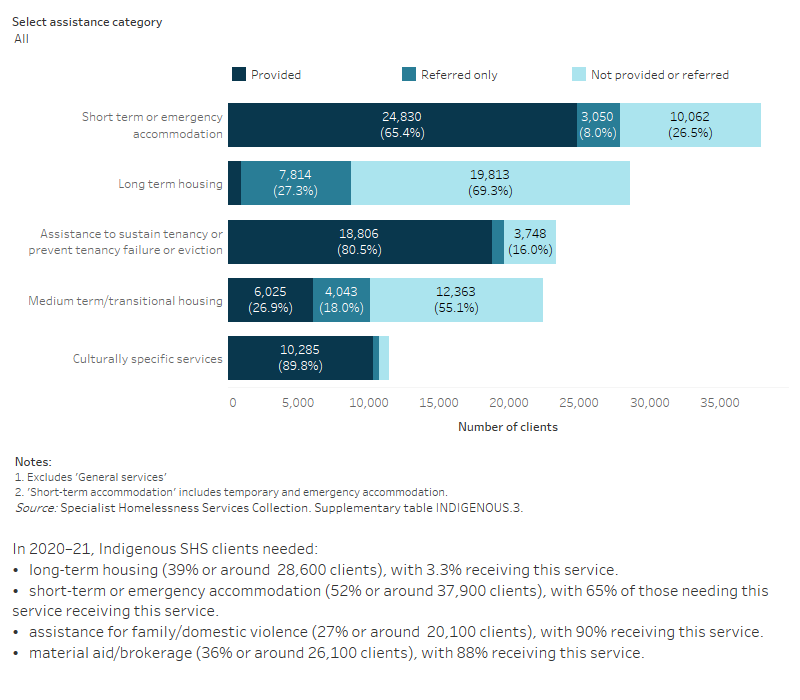
Figure INDIGENOUS.3: Indigenous clients, by services needed and provided, 2020–21
This interactive stacked horizontal bar graph shows the services needed by Indigenous clients and their provision status. Short term accommodation was the most needed and most provided service. Long term housing was the least provided service.
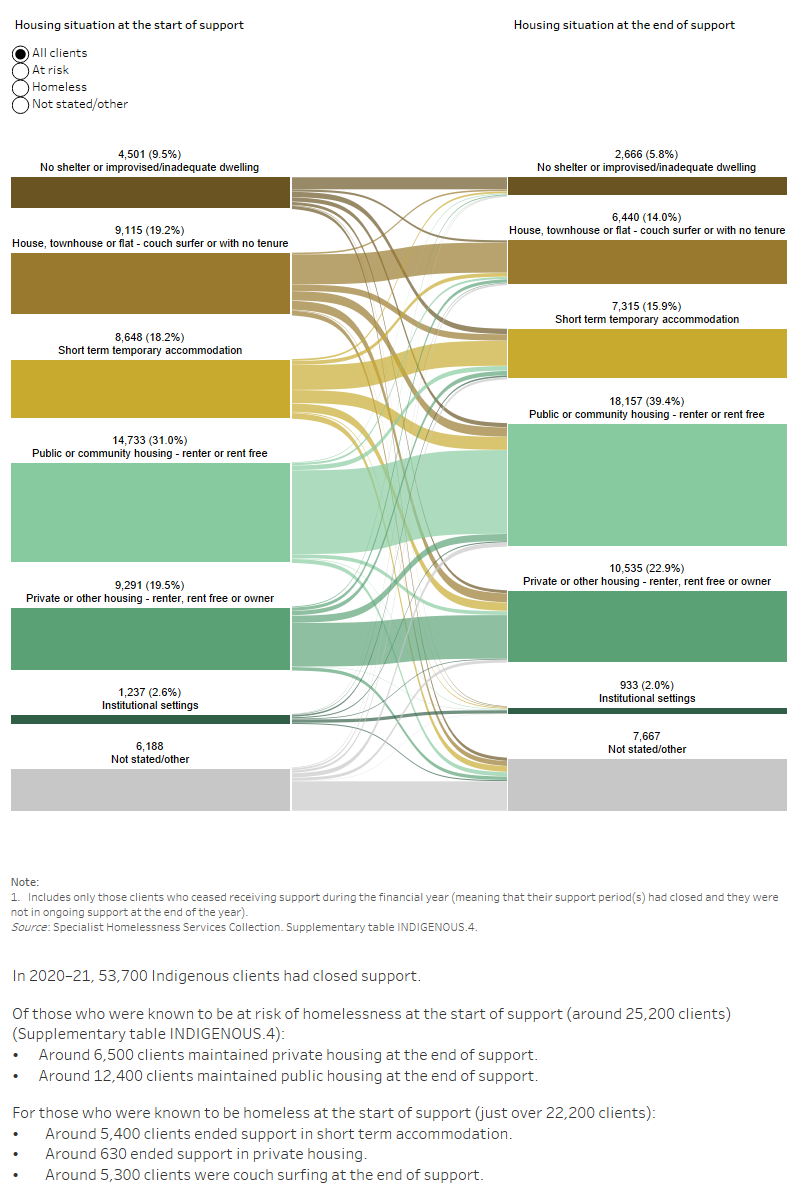
This interactive Sankey diagram shows the housing situation (including rough sleeping, couch surfing, short-term accommodation, public/community housing, private housing and institutional settings) of Indigenous clients with closed support periods at first presentation and at the end of support. The diagram shows clients’ housing situation journey from start to end of support. Most clients started and ended support in public housing.