Clients leaving care
Australians without stable accommodation after leaving health or social care arrangements can find themselves particularly vulnerable to homelessness. In particular, research has shown that young people exiting care can experience a range of poor outcomes, including homelessness and/or housing instability [1]. Recognising this vulnerability, people exiting institutions and care into homelessness are a national priority cohort listed in the National Housing and Homelessness Agreement [2], which came into effect on 1 July 2018.
The Beyond 18 study, currently being undertaken by the Australian Institute of Family Studies and the Victorian Department of Human Services, has found care leavers aged 18 years and over have a higher than average risk of homelessness, partially due to a shortage of affordable and appropriate housing [3].
In the context of the Specialist Homelessness Services Collection (SHSC), clients are identified as leaving care if, in their first support period during 2017–18 (either the week before or at the beginning of the support period):
- their dwelling type was: hospital, psychiatric hospital or unit, disability support, rehabilitation, aged care facility; or
- their reason for seeking assistance was: transition from foster care/child safety residential care, or transition from other care arrangements.
Key findings in 2017–18
- There were around 6,900 clients seeking support who were identified as having left care in 2017–18. More than half (57%) of these were aged 18–44 years, 10% (almost 700 clients) were aged 0–9.
- Two in 5 (41%) sought assistance as they were transitioning from foster care, child safety residential placements or other care arrangements.
- Almost 3 in 4 (74%) clients leaving care were at risk of homelessness at first presentation to Specialist Homelessness Services (SHS) agencies.
- Housing crisis was the most common main reason for seeking assistance from homelessness agencies, reported by 1 in 5 (20%) clients, followed by transitioning from other care arrangements (12%).
- 3 in 4 (76%) needed accommodation services.
- The median length of support was 63 days, and 48 nights of accommodation.
- At the end of support, 23% of clients were housed in private or other housing, 27% were living in institutional settings, and 17% were in public or community housing (renter or rent free).
- Around 1 in 3 were homeless at the end of support with 20% in short-term or emergency accommodation, 8% couch surfing and 5% with no shelter or living in an inadequate dwelling.
Profile of clients leaving care in 2017–18
Of the 6,900 clients leaving care seeking SHS support in 2017–18:
- Over half (53%) were leaving either a psychiatric hospital (19%), rehabilitation facility (18%) or a hospital (15%).
- Just over 2 in 5 clients (41% or 2,800 clients) sought assistance because they were transitioning from foster care/child safety residential placements or other care arrangements.
- The majority were male (55% or 3,800 clients).
- Around 1 in 4 clients leaving care were Indigenous (23%).
- More than 3 in 5 had received services in the past: returning clients made up 61% (or 4,200) of this group and 39% (or 2,700) were new clients. That is, more clients had received services at some point in the previous 5 years than those seeking assistance for the first time in 2017–18.
- The majority (59%) of clients were living alone when they sought assistance.
Vulnerabilities
Three of the main vulnerabilities reported in the SHS client population are mental health issues, problematic drug and/or alcohol use, and domestic and family violence. Of the SHS clients leaving care aged 10 and over in 2017–18 (Table LCARE.1):
- Over 4 in 5 clients (83% or around 5,400 clients) presented with at least 1 vulnerability; a reflection of the care types many of these clients are leaving (for example, hospital, psychiatric hospital/unit, rehabilitation).
- The majority (66% or 4,300) of clients leaving care reported a current mental health issue, and some reported multiple vulnerabilities:
- 1 in 5 (22% or about 1,400 clients) reported both mental health and problematic drug and/or alcohol use
- 1 in 10 (9% or about 600 clients) reported all three vulnerabilities.
- Almost 1 in 5 (17% or 1,100 clients) did not report any of the 3 vulnerabilities.
Table LCARE.1: Clients leaving care, by selected vulnerability characteristics, 2017–18
|
Domestic and family violence |
Mental health issue |
Problematic drug and/or alcohol use |
Clients |
Per cent |
|---|---|---|---|---|
|
Yes |
No |
No |
300 |
4.7 |
|
Yes |
Yes |
No |
600 |
9.1 |
|
Yes |
No |
Yes |
130 |
2.0 |
|
Yes |
Yes |
Yes |
580 |
8.8 |
|
No |
Yes |
Yes |
1,400 |
21.5 |
|
No |
Yes |
No |
1,700 |
26.8 |
|
No |
No |
Yes |
660 |
10.2 |
|
No |
No |
No |
1,100 |
16.7 |
|
|
|
|
6,500 |
100 |
Notes
- Client vulnerability groups are mutually exclusive.
- Clients are aged 10 and over.
- Totals may not sum due to rounding.
Source: Specialist Homelessness Services Collection 2017–18.
Clients leaving care: 2013–14 to 2017–18
Since 2013–14, the number of people leaving care and seeking assistance from specialist homelessness services has remained relatively stable. Key trends identified in this client population over the 5 years to 2017–18 are (Table LCARE.2):
- The rate of service use by clients leaving care is increasing, up from 2 people per 10,000 population in 2013–14 to 3 people per 10,000 population in 2017–18.
- Both the median length of support and number of support periods have remained steady. The longer length of support provided to these clients (compared with all SHS clients), together with the high proportion presenting with additional vulnerabilities (82%), implies that they are presenting with complex needs.
- 1 in 5 clients achieved all their case management goals, up from 16% in 2013–14.
Table LCARE.2: Clients leaving care: at a glance—2013–14 to 2017–18
|
|
2013–14 |
2014–15 |
2015–16 |
2016–17 |
2017–18 |
|---|---|---|---|---|---|
|
Number of clients |
5,573 |
6,084 |
6,869 |
7,104 |
6,917 |
|
Proportion of all clients |
2 |
2 |
2 |
2 |
2 |
|
Rate (per 10,000 population) |
2.4 |
2.6 |
2.9 |
2.9 |
2.8 |
|
Housing situation at the beginning of the first support period (proportion (per cent) of all clients) |
|||||
|
Homeless |
33 |
32 |
30 |
26 |
26 |
|
At risk of homelessness |
67 |
68 |
70 |
74 |
74 |
|
Length of support (median number of days) |
62 |
58 |
60 |
62 |
63 |
|
Average number of support periods per client |
1.7 |
1.8 |
1.9 |
1.9 |
1.9 |
|
Proportion receiving accommodation |
54 |
52 |
48 |
46 |
45 |
|
Median number of nights accommodated |
48 |
44 |
42 |
49 |
48 |
|
Proportion of a client group with a case management plan |
70 |
71 |
70 |
69 |
71 |
|
Achievement of all case management goals (per cent) |
16 |
19 |
17 |
18 |
21 |
Notes
- Rates are crude rates based on the Australian estimated resident population (ERP) at 30 June of the reference year. Minor adjustments in rates may occur between publications reflecting revision of the estimated resident population by the Australian Bureau of Statistics.
- The denominator for the proportion achieving all case management goals is the number of client groups with a case management plan. Denominator values for proportions are provided in the relevant national supplementary table.
- Data for 2013–14 to 2016–17 have been adjusted for non-response. Due to improvements in the rates of agency participation and SLK validity, 2017–18 data are not weighted. The removal of weighting does not constitute a break in time series and weighted data from 2013–14 to 2016–17 are comparable with unweighted data for 2017–18. For further information, please refer to the Technical Notes.
Source: Specialist Homelessness Services Collection 2013–14 to 2017–18.
Housing situation
At the beginning of support, the majority of clients leaving care were at risk of homelessness (74% or about 5,100 clients). More than 1 in 4 (26% or 1,800) clients leaving care were homeless when first reporting to SHS agencies for assistance in 2017–18.
Reasons for seeking assistance
The main reasons for seeking assistance provided by clients leaving care that differed from the general SHS population were:
- transition from other care arrangements (12%, compared with less than 1% of the general SHS population);
- transition from foster care and child safety residential placements (8%, compared with less than 1%);
- mental health issues (9%, compared with 1%);
- domestic and family violence (8%, compared with 30%).
Services needed and provided
Over 3 in 4 (76% or 5,200) clients leaving care needed accommodation services, much higher than the general SHS population (56%) (Supplementary table LCARE.3).
- More than half (52% or 3,600 clients) needed short-term or emergency accommodation, compared with 37% of the SHS general population.
- Almost half (44% or 3,000 clients) requested medium-term/transitional housing, higher than the general SHS population (28%). Clients leaving care were more likely to be provided with this type of accommodation than the SHS general population (34% compared with 29%).
- Long-term housing was requested by 46% (or around 3,200 clients) however, this was only provided to 8% of clients who needed it.
Other services most commonly needed by these clients were living skills/personal development (37%), transport (36%), and other basic assistance (79%). These services were needed by higher proportions of clients leaving care than clients in the general SHS population (20%, 20%, and 64%, respectively).
Housing outcomes
The outcomes presented in this section examine the changes in clients’ housing situations from the start of support to the end of support. Only clients who ceased receiving support by the end of the financial year are included in this section—meaning their support periods had closed and they did not have ongoing support at the end of the 2017–18 reporting period. However, it is important to note that a proportion of these clients may seek assistance from SHS agencies again in future.
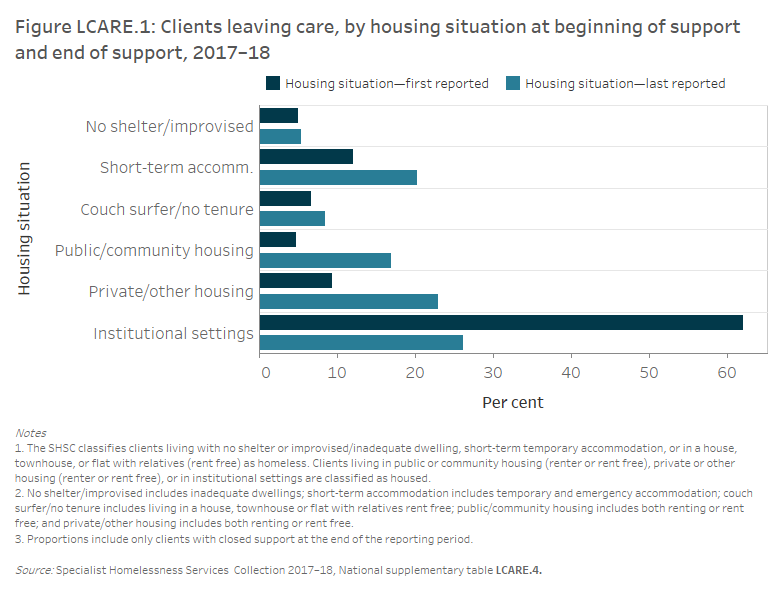
For clients leaving care (Figure LCARE.1):
- Around 26% (or 1,100 clients) were living in institutional settings at the end of support, compared with 3 in 5 clients (62% or nearly 2,900 clients) at the beginning of support.
- The proportion of clients in private or other housing had the greatest increase from beginning of support to the end of support, increasing from 9% to 23% (or from 400 to 950 clients).
- At the end of support, the proportion of clients classified as homeless increased (from 24% to 34%, or from 1,100 to 1,400 clients).
For clients leaving care and presenting to agencies housed, but at risk of homelessness (that is, living either in public or community housing (renter or rent free), private or other housing (renter or rent free), or in institutional settings) (Supplementary table LCARE.4):
- Almost 3 in 4 (73% or 2,300 clients) were assisted to maintain their housing.
- For clients living in public or community housing at the start of support, 3 in 4 (75% or 150 clients) were assisted to maintain their tenancy, 8% (or less than 20 clients) moved into private or other housing.
- For clients living in private or other housing almost 7 in 10 (68% or 280 clients) were assisted to maintain their tenancy, 11% (or less than 50 clients) moved into public or community housing.
Of those clients leaving care who were homeless when they began support (that is, living either with no shelter or improvised/inadequate dwelling, short-term temporary accommodation, or in a house, townhouse, or flat with relatives (rent free)) (Table LCARE.3):
- 44% (or 400 clients) were assisted into housing at the end of support.
- 56% (or 550 clients) remained homeless.
Table LCARE.3: Clients leaving care, housing situation at beginning and end of support, 2017–18 (per cent)
| Situation at beginning of support | Situation at end of support: homeless | Situation at end of support: housed |
|---|---|---|
|
Homeless |
56.0 |
44.0 |
|
At risk of homelessness |
26.6 |
73.4 |
Notes
- The SHSC classifies clients living with no shelter or improvised/ inadequate dwelling, short-term temporary accommodation, or in a house, townhouse, or flat with relatives (rent free) as homeless. Clients living in public or community housing (renter or rent free), private or other housing (renter or rent free), or in institutional settings are classified as housed.
- Proportions include only clients with closed support at the end of the reporting period. Per cent calculations are based on total clients, excluding ‘Not stated/other’.
Source: Specialist Homelessness Services Collection 2017–18, National supplementary table LCARE.4.
References
- Campo M, & Commerford J 2016. Supporting young people leaving out-of-home care (CFCA Paper No. 41) . Melbourne: Child Family Community Australia information exchange, Australian Institute of Family Studies.
- Council on Federal Financial Relations 2018. National Housing and Homelessness Agreement
- Muir S, & Hand K 2018. Beyond 18: The Longitudinal Study on Leaving Care Wave 1 Research Report: Transition planning and preparation. (Research Report) . Melbourne: Australian Institute of Family Studies.