Young people presenting alone
Young people require access to a range of accommodation and support services as they grow and develop their skills to live independently. Young people experiencing homelessness can face increased disadvantage than other cohorts, as they lack access to family support and networks, compounding the need for crisis and transitional housing assistance [1]. Children and young people are a national priority cohort listed in the National Housing and Homelessness Agreement [2], which came into effect on 1 July 2018.
According to Census data, there were approximately 27,700 homeless youth aged 12–24 years in 2016, representing 24% of the total estimated homeless population; up from 25,200 people in 2011 and 21,900 in 2006 [3,4,5].
Of the approximate 27,700 homeless youth in 2016, 59% (or 16,400) were living in 'severely' crowded dwellings, and 18% (or 5,000) were in supported accommodation for the homeless. Additionally, 10% (or 2,900) were staying temporarily with other households, and 9% (or 2,600) were living in boarding houses [3].
Although young people are over-represented in the homeless population, homeless estimates for youth are likely to have been underestimated in the Census [3]. For example, a usual address may be reported for 'couch surfers' because the young person is staying in a household on Census night. Their homelessness is masked as their characteristics look no different to other youth who are not homeless, but visiting another household on Census night [3].
Key findings in 2017–18
- There were around 43,200 young people aged 15–24 who presented alone to a specialist homelessness services (SHS) agency in 2017–18.
- Over half (52% or 22,500) of young clients were homeless at presentation to a SHS agency.
- A quarter (11,200 young people or 26%) were aged 15–17.
- Over 1 in 5 (22%) sought assistance due to unstable housing (housing crisis).
- More than half (55%) had received services in the previous 5 years.
- There were improvements in housing outcomes with fewer young clients homeless following support (40%, down from 53% at the beginning of support).
- Most young clients at risk of homelessness were assisted to maintain a housing tenancy (86%).
Profile of young people presenting alone in 2017–18
Of the 43,200 young people (aged 15–24) presenting alone to a specialist homelessness agency in 2017–18:
- Almost 2 in 3 (64% or 27,500 clients) clients were female.
- Just over half (55%) were returning clients, that is, they were assisted at some point in the previous 5 years.
- One in 4 (25%) were Indigenous.
- Two in 5 (41%) were living alone.
- Over 3 in 5 (61% or 26,400) presented to SHS agencies located in Major cities; 3% (or 1,500 clients) in Remote/very remote areas.
Vulnerabilities
Three of the main vulnerabilities reported in the SHS client population are mental health issues, domestic and family violence and problematic drug and/or alcohol use. Almost two-thirds (63% or 27,100) of young clients presenting alone reported at least one of these vulnerabilities (Table YOUNG.1):
- 2 in 5 reported mental health issues (41% or 17,700 clients).
- Almost 2 in 5 (37% or 15,800 clients) reported domestic and family violence.
- 5 per cent (or 2,300 clients) reported all three vulnerabilities.
- More than 1 in 3 (37%) reported experiencing none of these vulnerabilities, in line with all SHS clients (38%).
Table YOUNG.1: Young people presenting alone, by selected vulnerability characteristics, 2017–18
|
Domestic and family violence |
Mental health issue |
Problematic drug |
Clients |
Per cent |
|---|---|---|---|---|
|
Yes |
Yes |
Yes |
2,300 |
5.3 |
|
Yes |
No |
Yes |
400 |
1.0 |
|
Yes |
Yes |
No |
5,000 |
11.5 |
|
Yes |
No |
No |
8,100 |
18.7 |
|
No |
Yes |
Yes |
2,200 |
5.2 |
|
No |
Yes |
No |
8,200 |
18.9 |
|
No |
No |
Yes |
900 |
2.2 |
|
No |
No |
No |
16,100 |
37.2 |
|
|
|
|
43,200 |
100 |
Notes
1. Client vulnerability groups are mutually exclusive.
2. Clients are aged 15–24.
3. Totals may not sum due to rounding.
Source: Specialist Homelessness Services Collection 2017–18.
Young people presenting alone: 2013–14 to 2017–18
Since 2013–14, the number of young people presenting alone to an agency has remained relatively constant. Key trends over the past 5 years are (Table YOUNG.2):
- The rate of service use by young people presenting alone to SHS agencies has decreased from 19 young people per 10,000 in 2013–14 to 18 in 2017–18.
- Of all young people presenting alone between 2013–14 and 2017–18, over 1 in 4 (27%) were Indigenous.
- The median number of days of support and nights of accommodation for young people presenting alone was 49 days and 45 nights.
- Around 1 in 5 clients achieved all their case management goals across 2013–14 to 2017–18. This group remains one of the least likely of all priority groups to achieve all their case management goals.
Table YOUNG.2: Young people (15–24 years) presenting alone: at a glance—2013–14 to 2017–18
|
|
2013–14 |
2014–15 |
2015–16 |
2016–17 |
2017–18 |
|---|---|---|---|---|---|
|
Number of clients |
44,414 |
41,780 |
43,165 |
42,131 |
43,180 |
|
Proportion of all clients |
17 |
16 |
15 |
15 |
15 |
|
Rate (per 10,000 population) |
19.2 |
17.8 |
18.1 |
17.4 |
17.6 |
|
Housing situation at the beginning of the first support period (proportion (per cent) of all clients) |
|||||
|
Homeless |
50 |
52 |
52 |
52 |
52 |
|
At risk of homelessness |
50 |
48 |
48 |
48 |
48 |
|
Length of support (median number of days) |
46 |
44 |
44 |
47 |
49 |
|
Average number of support periods per client |
1.7 |
1.8 |
1.8 |
1.8 |
1.9 |
|
Proportion receiving accommodation |
36 |
35 |
34 |
31 |
31 |
|
Median number of nights accommodated |
41 |
41 |
41 |
44 |
45 |
|
Proportion of a client group with a case management plan |
57 |
58 |
60 |
60 |
63 |
|
Achievement of all case management goals (per cent) |
16 |
20 |
18 |
18 |
19 |
Notes
- Rates are crude rates based on the Australian estimated resident population (ERP) at 30 June of the reference year. Minor adjustments in rates may occur between publications reflecting revision of the estimated resident population by the Australian Bureau of Statistics.
- The denominator for the proportion achieving all case management goals is the number of client groups with a case management plan. Denominator values for proportions are provided in the relevant national supplementary table.
- Data for 2013–14 to 2016–17 have been adjusted for non-response. Due to improvements in the rates of agency participation and SLK validity, 2017–18 data are not weighted. The removal of weighting does not constitute a break in time series and weighted data from 2013–14 to 2016–17 are comparable with unweighted data for 2017–18. For further information, please refer to the Technical notes.
-
In 2017–18, age and age-related variables were derived using a more robust calculation method. Data for previous years have been updated with the improved calculation method for age. As such, data prior to 2017–18 contained in the SHS Annual Report may not match that contained in the SHS Annual Report Historical Tables.
Source: Specialist Homelessness Services Collection 2013–14 to 2017–18.
Housing situation
At the beginning of support around half of young people presenting alone to SHS agencies were homeless (52% or about 22,500 clients). A further 20,700 (or 48%) young people presenting alone were at risk of homelessness (Table YOUNG.2).
Reasons for seeking assistance
In 2017–18, the main reason young people presenting alone sought assistance included: housing crises (22% or 9,600 clients), domestic and family violence (18% or 7,800 clients), inadequate or inappropriate dwelling conditions (11% or 4,800 clients), and relationship/family breakdown (11% or 4,600 clients).
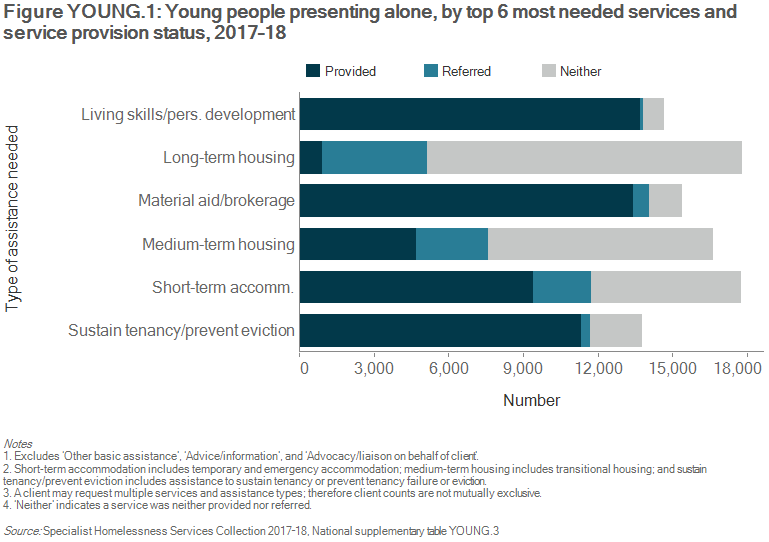
Services needed and provided
For young people presenting alone, the most common needs identified (excluding basic services such as advice/information, or advocacy/liaison) were accommodation related, with 63% requesting some form of accommodation (Figure YOUNG.1):
- Just over 4 in 10 requested short-term or emergency accommodation (41%), with 53% of those who needed it provided this accommodation.
- Just under 4 in 10 requested medium-term/transitional housing (38%), with 28% of those who needed it provided this accommodation.
- Just over 4 in 10 requested long-term housing (41%), with just 1 in 20 (5%) of those who needed it provided this accommodation.
Compared with the overall SHS population, young people presenting alone were more likely to be identified as needing assistance with:
- living skills/personal development (34% compared with 20% of the overall SHS population)
- education (20% compared with 8%)
- medium-term/transitional housing (38% compared with 28%)
- employment (16% compared with 6%).
The need for these services was unmet in some cases. Nearly 1 in 6 (17%) of those who identified a need for educational assistance were not provided that service, as were 54% of those who identified a need for medium-term/transitional housing, and 21% for employment assistance.
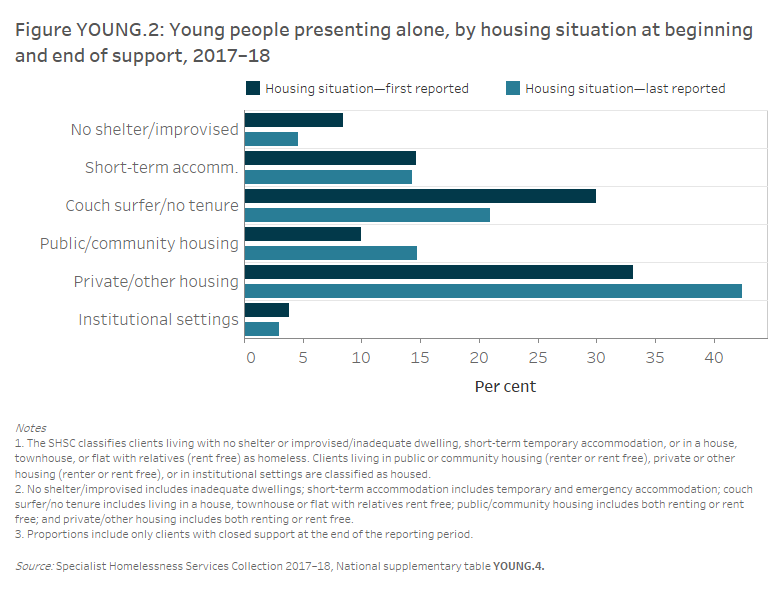
Housing outcomes
The outcomes presented in this section examine the changes in clients’ housing situations from the start to the end of support. Only clients who ceased receiving support by the end of the financial year are included in this section—meaning their support periods had closed and they did not have ongoing support at the end of the 2017–18 reporting period. However, it is important to note that a proportion of these clients may seek assistance from SHS agencies again in future.
For young people presenting alone (Figure YOUNG.2):
- The proportion of homelessness reduced: from 53% (or 14,300 clients) at the beginning of support to 40% (or 10,300 clients) at the end of support.
- The most common housing outcome for young people presenting alone was private or other housing (as a renter, rent free or owner) (42%, or 10,900 clients)—an increase from 33% (or 8,900 clients) at the beginning of support.
- ‘Couch surfing’ rates reduced. At the beginning of support, 30% (or 8,100) of young people who presented alone were ‘couch surfing’ or staying in housing with no tenure. This decreased to 21% (or 5,400 clients) by the end of support.
Where a young person presented housed, but at risk of homelessness (around 11,700) (that is, living either in public or community housing (renter or rent free), private or other housing (renter or rent free), or in institutional settings) (Table YOUNG.3):
- The majority of clients (86% or 10,100 clients) were assisted to maintain their housing.
- For young people living in public or community housing, over 7 in 10 (74% or 1,900 clients) were assisted to maintain this housing, and a further 13% (or 300 clients) were assisted into private or other housing.
- Where the young person was living in private or other housing, 80% (or 6,700 clients) were assisted to maintain this housing, and a further 5% (or about 400 clients) were assisted into public or community housing.
For those young people presenting alone who were homeless when they began support (around 12,800) (that is, living either with no shelter or improvised/inadequate dwelling, short-term or emergency accommodation, or in a house, townhouse, or flat with relatives (rent free)), (Table YOUNG.3):
- Almost 2 in 5 (37% or 4,700 clients) were assisted into housing.
- Of those clients who were in short-term or emergency accommodation at the beginning of support, 2 in 5 (40% or around 1,400 clients) were assisted into stable housing at the end of support.
- Rough sleepers (no shelter or improvised dwelling) were the least likely to end support in stable housing (31% or 600 clients).
- Of all young people who began support homeless, 63% (or 8,100 clients) remained homeless.
- The housing situation for around 6,600 young people presenting alone was unknown at the end of support.
Table YOUNG.3: Young people presenting alone, housing situation at beginning and end of support, 2017–18 (per cent)
| Situation at beginning of support | Situation at end of support: homeless | Situation at end of support: housed |
|---|---|---|
|
Homeless |
63.2 |
36.8 |
|
At risk of homelessness |
14.3 |
85.7 |
Notes
- The SHSC classifies clients living with no shelter or improvised/ inadequate dwelling, short-term temporary accommodation, or in a house, townhouse, or flat with relatives (rent free) as homeless. Clients living in public or community housing (renter or rent free), private or other housing (renter or rent free), or in institutional settings are classified as housed.
- Proportions include only clients with closed support at the end of the reporting period. Per cent calculations are based on total clients, excluding ‘Not stated/other’.
Source: Specialist Homelessness Services Collection 2017–18, National supplementary table YOUNG.4.
References
- Homelessness Australia. 2017. A National Homelessness Strategy: why we need it. Strengthening the service response to people who are homeless or at risk of homelessness.
- Council on Federal Financial Relations 2018. National Housing and Homelessness Agreement.
- Australian Bureau of Statistics (ABS) 2016. Census of population and housing: estimating homelessness, 2016. ABS cat. No. 2049.0. Canberra: ABS.
- ABS 2011. Census of population and housing: estimating homelessness, 2011. ABS cat. No. 2049.0. Canberra: ABS.
- ABS 2006. Census of population and housing: estimating homelessness, 2006. ABS cat. No. 2049.0. Canberra: ABS.