Service geography
Access to services can become increasingly difficult the further away a client is from a major city [1]. This section examines service needs and client characteristics based on the location of the Specialist Homelessness Service (SHS) agency. Clients can access services in more than one remoteness area, however, for the purpose of the analysis, clients are assigned to one remoteness area based on the SHS agency where they first sought support in 2017–18. The Australian Statistical Geography Standard (ASGS) [2] is used to classify agencies by remoteness area based on the location details of each agency (see Technical information).
Key findings in 2017–18
- Agency client numbers increased across Major cities and Inner regional areas in 2017–18, while Outer regional and Remote/very remote numbers decreased from the previous year.
- Agencies in Major cities had the greatest increase in client numbers (over 1,000 clients) while agencies in Outer regional areas had the greatest decrease (over 700 clients) compared with 2016–17.
- The housing situation of clients when seeking assistance was very different across regional areas, with most clients in Remote/very remote areas (72%) at risk of homelessness, compared with just over half for all other regional areas (56–57%).
- The rate of service was highest in Remote/very remote areas, 1 in 37 people compared with 1 in 99 in Major cities and 1 in 67 in Inner and Outer regional areas in 2017–18.
- Remote/very remote areas had higher proportions of couples presenting with children compared with Major cities (19% compared with 12%) while the proportion of lone persons was higher in Major cities than in Remote/very remote areas (31% compared with 16%).
Specialist homelessness services across urban and remote areas in 2017–18
In interpreting regional service trends, urban areas refer to Major cities and Inner and Outer regional areas. In 2017–18 clients from SHS agencies in urban and remote areas displayed distinct characteristics:
- 2 in 3 (66%) SHS clients with a current mental health issue and 86% of SHS clients born overseas accessed SHS in Major cities.
- 9 in 10 (91%) clients seeking services in Remote/very remote areas were Indigenous (Supplementary table INDIGENOUS.5).
- The proportion of people who were homeless upon presentation was lowest among the client groups of services in Remote/very remote areas: 28% compared with 44% in urban areas (Major cities and Inner and Outer regional areas) in 2017–18 (Table REG.1).
- In 2017–18, the median length of accommodation received by clients of services in Major cities was 46 nights, compared with 5 nights in Remote/very remote areas (Table REG.1).
- The main reason clients sought assistance varied across regional areas. Domestic and family violence and housing crisis were reported as the main reason by clients of services in Major cities (32%, 22%, respectively), Inner regional (25%, 21%), and Outer regional (25%, 21%) areas. Domestic and family violence was reported by almost 4 in 10 clients (38% up from 33% in 2016–17) of services in Remote/very remote areas and housing crisis by just 11%.
Specialist homelessness services across urban and remote areas: 2014–15 to 2017–18
The SHS collection continues to reveal differences in client characteristics and service needs across Australia. Some key regional service trends over the past 4 years include:
- Taking into account population differences, agencies in Remote/very remote areas consistently reported the highest rate of homelessness service use (Table REG.1). The rate of SHS clients accessing services located in Remote/very remote areas was 2.7 times higher than in Major cities in 2017–18, up from 2.3 times in 2014–15.
- Though services in Inner regional areas had the largest average annual growth in client numbers (4.7%), services in Remote/very remote areas had the largest growth in the rate of service use, increasing on average by 5.3% each year since 2014–15.
- The proportion of Indigenous clients in Remote/very remote areas has increased from 89% in 2014–15 to 91% in 2017–18. Inner regional areas have also seen an increase in the share of clients who are Indigenous with 25% of clients identifying as Indigenous in these areas in 2017–18, a rise of 4 percentage points over the 4-year period.
- Domestic and family violence has remained the main reason clients sought assistance in all regional areas in 2017–18.
Table REG.1: Clients by agency geographic area: at a glance—2014–15 to 2017–18
|
Year |
Major cities |
Inner regional |
Outer regional |
Remote/very remote |
|
|---|---|---|---|---|---|
|
2017–18 |
Number |
179,323 |
65,671 |
30,352 |
13,449 |
|
2017–18 |
Per cent |
62 |
23 |
11 |
5 |
|
2016–17 |
Number |
178,197 |
65,330 |
31,131 |
13,614 |
|
2016–17 |
Per cent |
62 |
23 |
11 |
5 |
|
2015–16 |
Number |
174,744 |
60,013 |
30,790 |
13,650 |
|
2015–16 |
Per cent |
63 |
21 |
11 |
5 |
|
2014–15 |
Number |
162,286 |
52,061 |
28,257 |
13,053 |
|
2014–15 |
Per cent |
63 |
20 |
11 |
5 |
|
Year |
Major cities |
Inner regional |
Outer regional |
Remote/very remote |
|---|---|---|---|---|
|
2017–18 |
101.5 |
149.6 |
148.2 |
273.0 |
|
2016–17 |
103.4 |
148.9 |
149.0 |
271.5 |
|
2015–16 |
103.3 |
138.5 |
147.7 |
267.7 |
|
2014–15 |
97.6 |
121.6 |
136.0 |
252.0 |
|
Year |
Major cities |
Inner regional |
Outer regional |
Remote/very remote |
|
|---|---|---|---|---|---|
|
2017–18 |
Homeless |
44 |
43 |
44 |
28 |
|
2017–18 |
At risk of homelessness |
56 |
57 |
56 |
72 |
|
2016–17 |
Homeless |
46 |
43 |
42 |
27 |
|
2016–17 |
At risk of homelessness |
54 |
57 |
58 |
73 |
|
2015–16 |
Homeless |
45 |
43 |
43 |
27 |
|
2015–16 |
At risk of homelessness |
55 |
57 |
57 |
73 |
|
2014–15 |
Homeless |
45 |
41 |
43 |
29 |
|
2014–15 |
At risk of homelessness |
55 |
59 |
57 |
71 |
|
Year |
Major cities |
Inner regional |
Outer regional |
Remote/very remote |
|---|---|---|---|---|
|
2017–18 |
35 |
53 |
39 |
20 |
|
2016–17 |
34 |
46 |
37 |
20 |
|
2015–16 |
33 |
41 |
36 |
17 |
|
2014–15 |
32 |
39 |
36 |
17 |
|
Year |
Major cities |
Inner regional |
Outer regional |
Remote/very remote |
|---|---|---|---|---|
|
2017–18 |
1.8 |
1.6 |
1.5 |
1.6 |
|
2016–17 |
1.8 |
1.6 |
1.5 |
1.6 |
|
2015–16 |
1.7 |
1.6 |
1.5 |
1.5 |
|
2014–15 |
1.7 |
1.5 |
1.5 |
1.5 |
|
Year |
Major cities |
Inner regional |
Outer regional |
Remote/very remote |
|---|---|---|---|---|
|
2017–18 |
27 |
25 |
36 |
62 |
|
2016–17 |
28 |
25 |
37 |
59 |
|
2015–16 |
29 |
27 |
39 |
62 |
|
2014–15 |
31 |
29 |
41 |
58 |
|
Year |
Major cities |
Inner regional |
Outer regional |
Remote/very remote |
|---|---|---|---|---|
|
2017–18 |
46 |
34 |
23 |
5 |
|
2016–17 |
48 |
31 |
24 |
5 |
|
2015–16 |
48 |
34 |
23 |
5 |
|
2014–15 |
48 |
35 |
21 |
5 |
|
Year |
Major cities |
Inner regional |
Outer regional |
Remote/very remote |
|---|---|---|---|---|
|
2017–18 |
60 |
66 |
77 |
65 |
|
2016–17 |
59 |
64 |
74 |
64 |
|
2015–16 |
59 |
61 |
75 |
60 |
|
2014–15 |
58 |
61 |
73 |
62 |
|
Year |
Major cities |
Inner regional |
Outer regional |
Remote/very remote |
|---|---|---|---|---|
|
2017–18 |
25 |
17 |
34 |
24 |
|
2016–17 |
25 |
16 |
27 |
23 |
|
2015–16 |
24 |
16 |
31 |
27 |
|
2014–15 |
27 |
18 |
30 |
29 |
Notes
- Rates are crude rates based on the Australian estimated resident population (ERP) at 30 June of the reference year. Minor adjustments in rates may occur between publications reflecting revision of the estimated resident population by the Australian Bureau of Statistics.
- The denominator for the proportion achieving all case management goals is the number of client groups with a case management plan. Denominator values for proportions are provided in the relevant National supplementary table.
- Previous years’ data can be found in the 2016–17 Specialist Homelessness Services Annual report.
- Data for 2014–15 to 2016–17 have been adjusted for non-response. Due to improvements in the rates of agency participation and SLK validity, 2017–18 data are not weighted. The removal of weighting does not constitute a break in time series and weighted data from 2014–15 to 2016–17 are comparable with unweighted data for 2017–18. For further information, please refer to the Technical notes.
Source: Specialist Homelessness Services Collection 2014–15 to 2017–18.
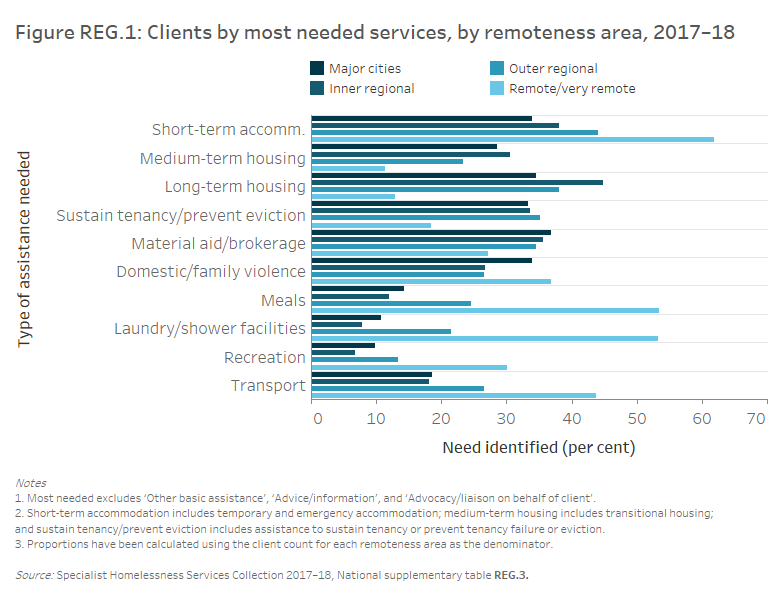
Services needed and provided
The proportion of clients needing short-term or emergency accommodation increased as remoteness of the service provider increased: Major cities 34%, Inner regional areas 38%, Outer regional areas 44%, and Remote/very remote areas 62%.
Just under half of clients of Inner regional services needed long-term housing. Trends for clients accessing services in Inner regional areas were generally similar to those in Major cities. However, a higher proportion of clients seeking support in Inner regional areas needed long-term housing (45% compared with 35% in Major cities).
Nearly 9 in 10 requests for accommodation were met by services in Remote/very remote areas (88%), while clients of services in Major cities and Inner regional areas were the least likely to receive accommodation (52% and 41% of need met, respectively). Clients in Remote/very remote areas were more likely to receive short-term or emergency accommodation (92%) than those in Major cities (52%) and Inner regional (50%) areas.
Need for mental health services was higher among clients of services in Major cities (10% or over 18,600 clients) and Inner regional areas (8% or over 5,400 clients) than those in Outer regional areas (7% or over 2,000 clients) and Remote/very remote areas (4% or over 500 clients).
Housing outcomes
For the purpose of the SHSC, stable housing refers to clients ending support in public or community housing (renter or rent free), private or other housing (renter, rent free or owner), or institutional settings.
- Clients accessing services in Major cities were the least likely to end support in stable housing (67%), noting that this group was also most likely to present homeless.
- Clients of Inner regional services were the most likely to be housed in private or other housing following support (48%). They were also the most likely to improve their housing situation following SHS assistance with 70% housed at the end of support, up 13 percentage points from the beginning of support.
- Clients accessing agencies in Remote/very remote areas were more likely to report living in public or community housing (61%) at the beginning of their support. The majority of these clients (93%) were in stable housing at the end of support.
There are differences in stable housing achievements for clients who either present homeless or housed (at risk of homelessness). Across all regions, agencies were best able to assist those presenting at risk of homelessness, with 9 in 10 (90%) maintaining their housing following support. For those clients presenting homeless, agencies were able to assist around 4 in 10 clients into stable housing at the end of support.
| Situation at beginning of support | Situation at end of support: homeless |
Situation at end of support: housed |
|---|---|---|
|
Major cities |
|
|
|
Homeless |
63.6 |
36.4 |
|
At risk of homelessness |
9.8 |
90.2 |
|
Inner regional |
|
|
|
Homeless |
57.9 |
42.1 |
|
At risk of homelessness |
10.0 |
90.0 |
|
Outer regional |
|
|
|
Homeless |
60.9 |
39.1 |
|
At risk of homelessness |
9.7 |
90.3 |
|
Remove/very remote |
|
|
|
Homeless |
61.0 |
39.0 |
|
At risk of homelessness |
7.9 |
92.1 |
Notes
- The SHSC classifies clients living with no shelter or improvised/inadequate dwelling, short-term temporary accommodation, or in a house, townhouse, or flat with relatives (rent free) as homeless. Clients living in public or community housing (renter or rent free), private or other housing (renter or rent free), or in institutional settings are classified as housed.
- Proportions include only clients with closed support at the end of the reporting period. Per cent calculations are based on total clients, excluding ‘Not stated/other’.
Source: Specialist Homelessness Services Collection 2017–18, National supplementary table REG.4.
References
- Wood G, Batterham D, Cigdem M & Mallett S 2014. The spatial dynamics of homelessness in Australia 2001–11, AHURI Final Report No.227. Melbourne: Australian Housing and Urban Research Institute. Viewed October 2018.
- Australian Bureau of Statistics 2018. Australian Statistical Geography Standard (ASGS): Volume 5—Remoteness structure, July 2016. ABS cat. no. 1270.0.55.005. Canberra: ABS.