Service geography

Key findings: Clients of SHS agencies, by remoteness area, 2022–23

This image highlights a number of key findings concerning service geography. Most clients were supported by services in major cities. The rate of SHS clients in remote/very remote areas was 3.8  times higher than in major cities. The median nights of accommodation was highest in inner regional areas. The proportion of accommodation requests met was highest in remote/very remote areas. Family and domestic violence was the most common main reason for seeking support in remote/very remote areas.

Accessing services can be increasingly difficult the further away a client is from a major city (ABS 2023). For Specialist Homelessness Services (SHS), state and territory systems for the assessment, intake, referral and case management vary, ranging from agency-based to centralised management models (PC 2023). The rate at which people seek support from SHS agencies can vary by remoteness due to varying service availability and region-specific factors, such as housing availability and affordability.

Reporting service location in the Specialist Homelessness Services Collection (SHSC)

This section examines client service needs and characteristics based on the location of the SHS agency. That is, the specific areas where clients first received support. Although clients can access services in multiple remoteness area, clients are assigned to one remoteness area based on the SHS agency where they first sought support during 2022–23. The location details of agencies were classified into remoteness areas based on the 2021 Australian Statistical Geography Standard (ASGS) (see Technical notes) (ABS 2023).

State-wide SHS operate in some states/territories and can assist a high number of clients over the phone. Therefore, service location data may not be accurate or relevant for some clients.

When interpreting regional service trends throughout this section, ‘urban areas’ refer to Major cities and Inner and Outer regional areas and ‘remote areas’ refer to Remote and Very remote areas, unless stated otherwise.

Specialist homelessness services across urban and remote areas

In 2022–23, the characteristics of clients who accessed SHS agencies in urban areas differed from those in remote areas:

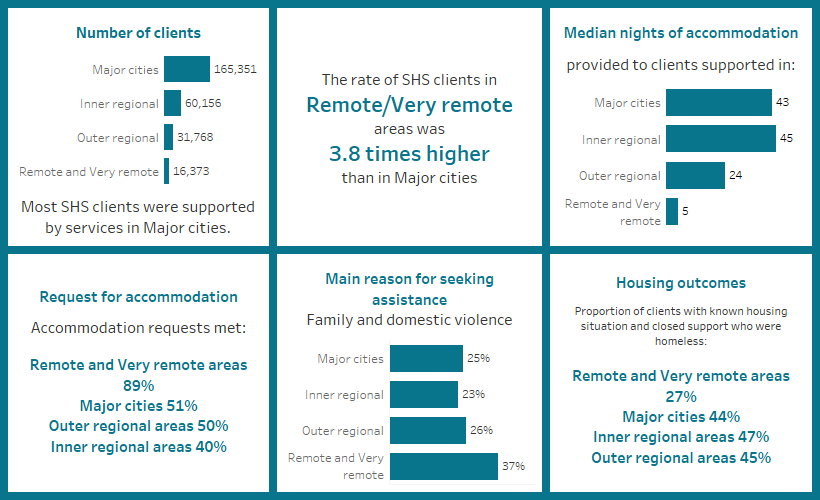
  • Clients experiencing homelessness at first presentation was more common for clients receiving support from agencies in urban areas (46%) than remote areas (28%) (Supplementary table REG.5).
  • At first presentation, clients in urban areas were most commonly living in private or other housing (38%), while most clients in remote areas were living public or community housing (60%) (Supplementary table REG.5).
  • More than 9 in 10 clients (92%) receiving services in remote areas were Indigenous people (Supplementary table INDIGENOUS.6).
  • Almost all (99%) SHS clients born overseas received support from SHS agencies in urban areas (Supplementary table CLIENTS.6).
  • Almost all (99%) clients with a current mental health issue received assistance from agencies in urban areas (Supplementary table CLIENTS.46).

The most common main reasons clients sought assistance in the various remoteness areas (Supplementary table REG.1) were:

  • Major cities: family and domestic violence (25%), followed by housing crisis (21%).
  • Inner and Outer regional areasfamily and domestic violence (23% and 26% respectively) and housing crisis (22% and 20% respectively).
  • Remote areasfamily and domestic violence (37%) and inadequate or inappropriate dwelling conditions (7.4%).

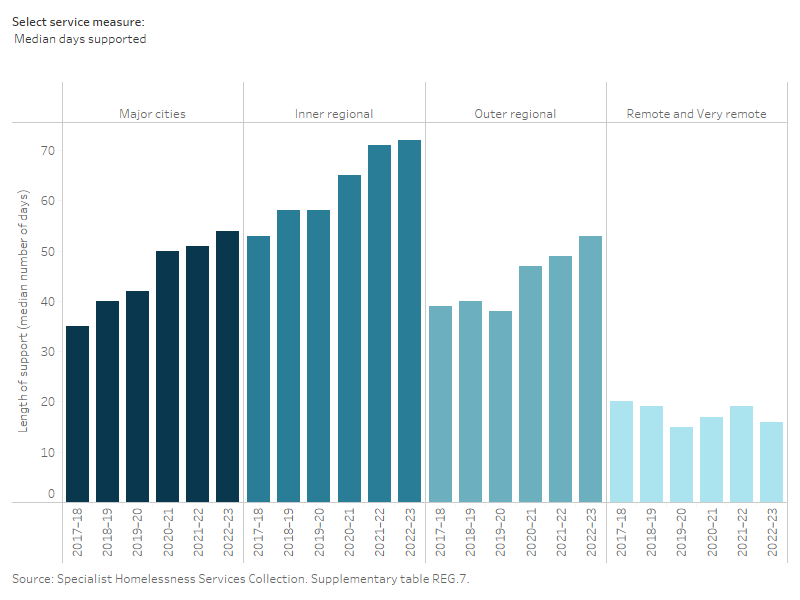
Figure REG.1: Service use patterns for SHS clients by remoteness area, 2017–18 to 2022–23

This interactive bar graph shows service use patterns by remoteness areas between 2017–18 and 2022–23. The graph presents data for the median number of days clients received support from SHS agencies, the average number of support periods per client, and the median number of nights accommodated. Across all five years, clients in inner regional areas had the highest median number of support days, and clients in remote and very remote areas had the lowest median number of support days.

Although the number of clients accessing SHS services has generally increased between 2011–12 and 2022–23 in each remoteness area, the rate of clients and changes over time have varied (Figure REG.1, Historical data table HIST.REG, Supplementary table REG.7): 

  • Major cities: The rate of clients accessing services has been decreasing since 2016–17 (102.5 per 10,000 population to 88.0 in 2022–23); the median number of days supported has increased from 35 days in 2017–18 to 54 days in 2022–23.
  • Inner regional: The rate of clients accessing services has been decreasing since 2018–19 (154.0 per 10,000 population to 130.1 in 2022–23); the median number of days supported has increased from 53 days in 2017–18 to 72 days in 2022–23.
  • Outer regional: The rate of clients accessing services has remained relatively constant since 2015–16 (152.3 per 10,000 population to 151.3 in 2022–23); the median number of days supported has increased from 39 days in 2017–18 to 53 days in 2022–23.
  • Remote areas: The rate of clients accessing services has generally been increasing since 2011–12 (208.1 clients per 10,000 population) to 331.9 in 2022–23. However between 2021–22 and 2022–23 the rate decreased from 344.0. The median number of days supported has decreased from 20 days in 2017–18 to 16 days in 2022–23.

Services needed and provided

In 2022–23 (Figure REG.2, Supplementary table REG.4):

  • Around 9 in 10 (89%) requests for accommodation were met by agencies in remote areas, while clients of services in Major cities and Inner regional areas were less likely to receive accommodation (51% and 40% provided, respectively).
  • The need for short-term or emergency accommodation was highest for clients of SHS agencies in remote areas (60%).
  • Half of clients in Inner regional areas (50%) needed long-term housing compared with around 2 in 5 clients in Major cities (39%) and Outer regional areas (38%).
  • Clients in remote areas were more likely to receive short-term or emergency accommodation (93%) than those in Major cities (58%) and Inner regional (45%) areas.
  • Need for mental health services was higher among clients of services in Major cities (9.4%) and Inner regional areas (8.0%) than those in Outer regional areas (6.4%) and remote areas (2.7%).

Figure REG.2: Clients by services needed, by provision status, by remoteness area, 2022–23

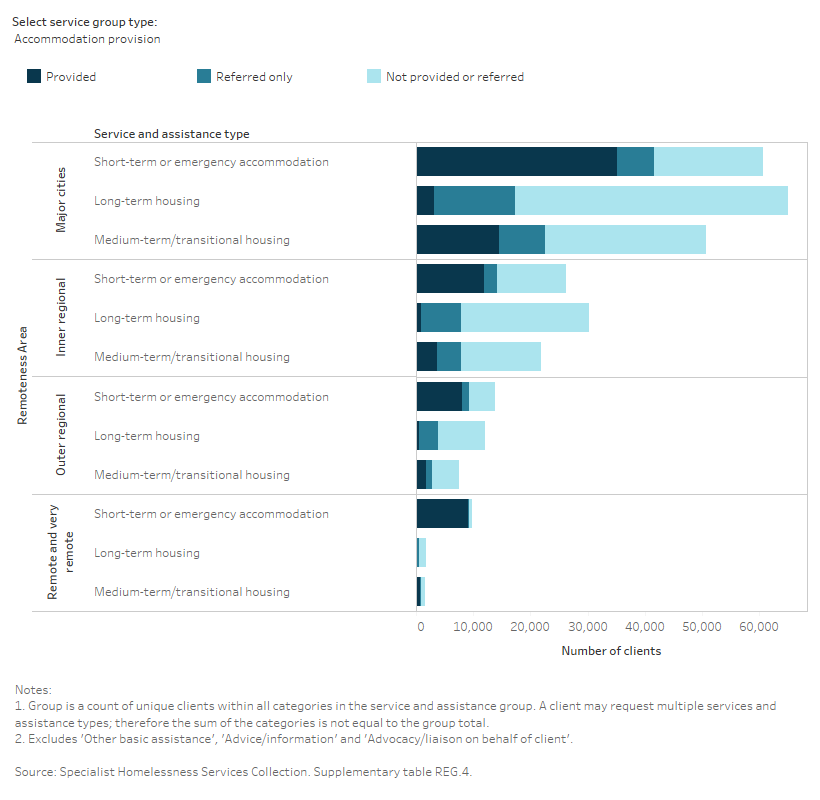
This interactive horizontal bar graph shows services needed by provision status and by remoteness area. Long-term housing was the most needed accommodation provision service in major cities and the least provided. Short-term or emergency accommodation was the most commonly provided accommodation service across all remoteness areas.

Outcomes at the end of support

Outcomes presented here highlight the changes in clients’ housing situation at the start and end of support. That is, the place they were residing before and after they were supported by a SHS agency. The information presented is limited only to clients who have stopped receiving support during the financial year, and who were no longer receiving ongoing support from a SHS agency. In particular, information on client housing situations at the start of their first period of support during 2022–23 is compared with the end of their last period of support in 2022–23. As such, this information does not cover any changes to their housing support period.

In 2022–23 (Supplementary table REG.5):

  • Clients in Major cities (44%) and Inner regional (42%) areas were the most likely to be housed in private or other housing at the end of support.
  • Clients in remote areas were most commonly living in public or community housing at the beginning (60%) and end (64%) of their support than clients in other areas.
  • Around 3 in 4 clients in remote areas (76%) were housed by the end of support, compared with around 2 in 3 clients in other areas: Major cities 65%, Inner regional 64%, Outer regional 63%.
  • Around 1 in 3 clients experiencing homelessness at the start of support were housed by the end of support across all of the remoteness areas: Major cities 31%, Inner regional 32%, Outer regional 30% and remote areas 29%.

Figure REG.3: Clients with closed support, by remoteness area, by housing situation at the beginning and end of support, 2022–23

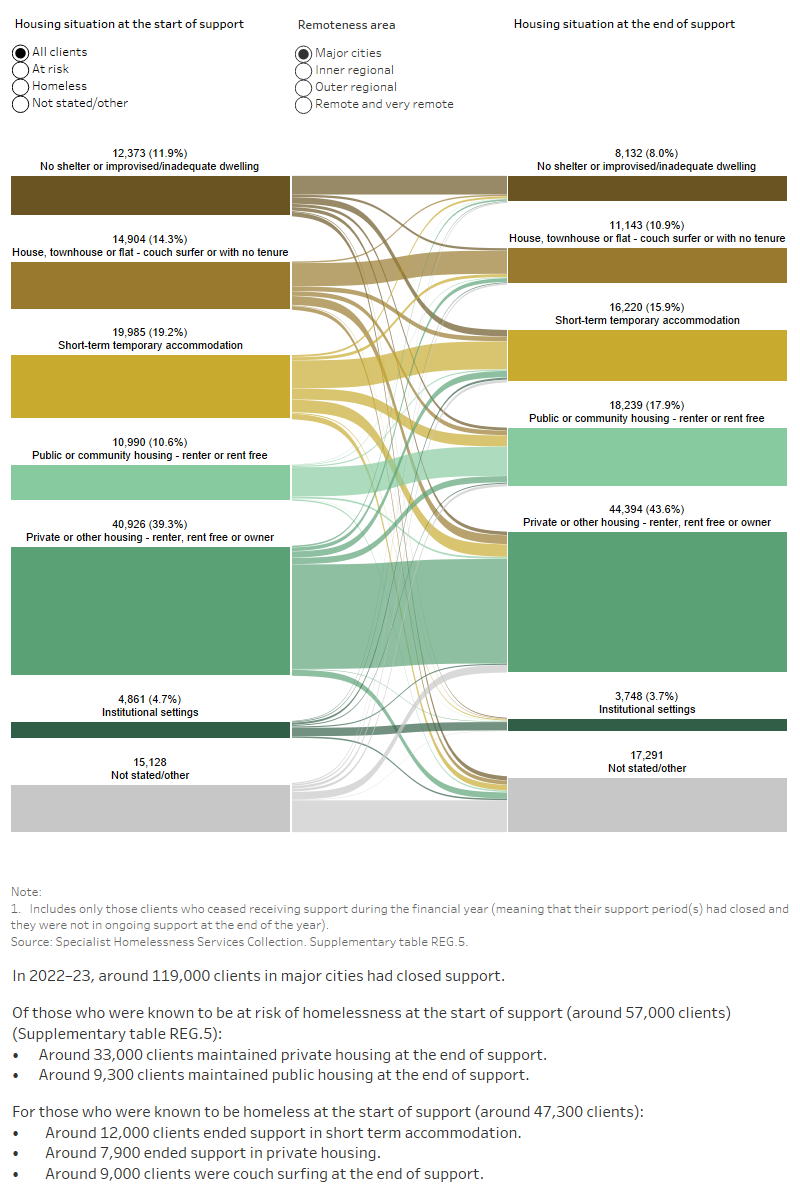
This interactive Sankey diagram shows the housing situation (including rough sleeping, couch surfing, short-term accommodation, public/community housing, private housing and institutional settings) of clients with closed support periods at first presentation and at the end of support, by remoteness area. The diagram shows clients’ housing situation journey from start to end of support. Most clients started and ended support in private or other housing.