Hospital activity

In 2022–23 there were:

  • 8.8 million presentations to emergency departments
  • 735,000 admissions from public hospital elective surgery waiting lists.

In 2021–22 there were:

  • 11.6 million hospitalisations (admitted patient care) 
  • 55.4 million non-admitted patient (outpatient) services delivered.

Emergency department care activity

How much care do our emergency departments provide?

In Australia, there are 293 public hospitals that have purpose-built emergency departments that are staffed 24 hours a day and provide care to patients who require urgent medical, surgical, or other attention.

In 2022–23, there were 8.8 million presentations to emergency departments – 334 presentations per 1,000 population. This has increased from 330 presentations per 1,000 population in 2018–19 – an increase of 0.3% a year.

In 2022–23, 70% of presentations occurred between 8 am and 8 pm. The busiest days for emergency department visits were Sundays, Mondays and Tuesdays.

How urgent was the care?

When a patient presents to the emergency department, they are assigned a triage category by a registered nurse or medical practitioner. The triage category allocated reflects the urgency of the patient’s need for medical and nursing care (Table 2).

Table 2: Emergency department presentations by triage category, 2022–23


Resuscitation (should be seen immediately)

Emergency (within 10 minutes)

Urgent (within 30 minutes)

Semi-urgent (within 60 minutes)

Non-urgent (within 2 hours)

Total

Presentations

77,230

1,431,840

3,557,510

3,135,480

596,140

8,800,919

Proportion of all presentations (%)

0.9%

16.3%

40.4%

35.6%

6.8%

100%

In 2022–23, 26% of patients arrived at the emergency department by ambulance or air rescue service, with the remaining 74% arriving by other forms of transport, including by private car.

Why do people present to emergency departments?

A patient’s diagnosis is established at the end of the patient’s emergency department stay and identifies the main reason for their visit to the emergency department.

In 2022–23, the most common reason for a presentation at an emergency department was for ‘Symptoms, signs, and abnormal findings’ – accounting for 26% of presentations. ‘Symptoms, signs, and abnormal findings’ are symptoms such as abnormalities of heartbeat, abnormalities of breathing, chest pain, nausea and vomiting, headache, and convulsions that are not attributable to a specific diagnosis based on the information available at the time of the care.

The most common diagnoses recorded for emergency department presentations vary by the age of the patient. (Figure 2).

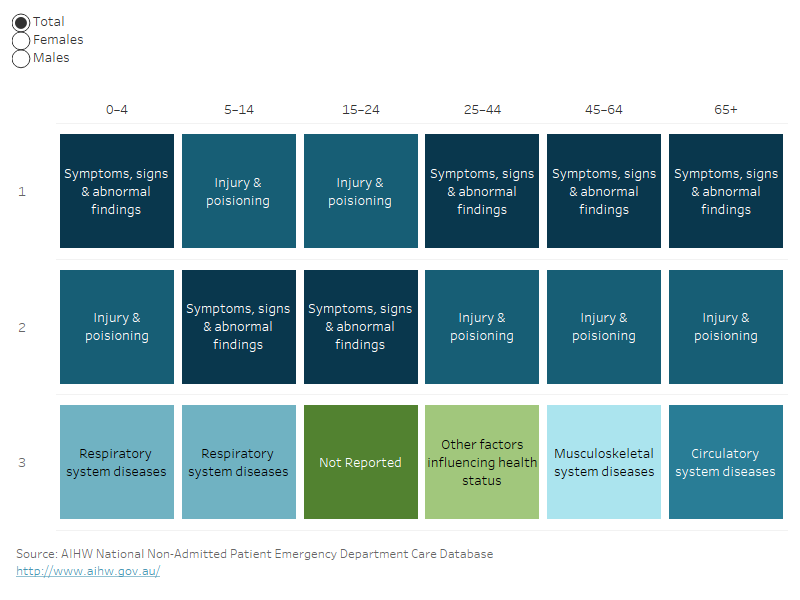
The table ranks the top 3 reasons people present to emergency departments in 2022–23 by age-group using the ICD-10-AM chapter. The top reason people across all age groups present to emergency department is for either ‘Injury and poisoning’ or ‘Symptoms, signs, and abnormal findings'

Admitted patient care activity

How many hospitalisations were there?

Admission to hospital is an administrative process that follows a doctor’s decision that a patient needs to be admitted for appropriate management or treatment of their condition, and/or for appropriate care or assessment of their needs. Patients may be admitted and discharged on the same day or may stay in hospital for one or more nights.

In 2021–22, there were 11.6 million hospitalisations (405 per 1,000 population). Public hospitals provided 59% (6.8 million) of hospitalisations and private hospitals provided 41% (4.8 million).

Since 2017–18, hospitalisations have increased from 11.2 million (6.6 million in public hospitals and 4.5 million in private hospitals). The rate of hospitalisations per 1,000 population decreased over the same period in public hospitals from 252 to 242 per 1,000 population and in private hospitals from 168 to 163 per 1,000 population.

Collectively, hospitals provided 31.8 million days of patient care in 2021–22. This was an increase since 2017–18 when 30.2 million days of patient care were provided.

Table 3: Characteristics of admitted patient care, public and private hospitals, 2021–22
 Public hospitalsPrivate hospitalsAll hospitals
Hospitalisations6.8 million4.8 million11.6 million
Medical4.8 million1.6 million6.4 million
General intervention (Surgical)999,0001.6 million2.6 million
Specific intervention (Other)443,000933,0001.4 million
Childbirth232,00069,000301,000
Mental health care134,000218,000352,000
Sub-acute and non-acute care211,000332,000543,000
Overnight versus same day55% same-day stays73% same-day stays63% same-day stays
Number of days of patient care21.7 million (average increase of 1.9% per year since 2017–18)10.0 million (average increase of 0.2% per year since 2017–18)31.8 million (average annual increase of 1.3% since 2017–18)
Average length of stay (for overnight stays)5.9 days5.2 days5.7 days

Why do people go to hospital?

People experience different health issues at different times of their lives, so the reasons for hospitalisation vary by age and by sex (Figure 3). For example, in 2021–22:

  • babies and children under 5 were hospitalised most often for Perinatal period conditions, whereas boys aged 5–14 were most often hospitalised for diagnoses related to Injury and poisoning and girls were most often hospitalised for digestive system diseases
  • males aged 15–24 were most often hospitalised for diagnoses related to Injury and poisoning, however, females in this age group were most often hospitalised for diagnoses related to Pregnancy, childbirth and the puerperium
  • adults aged 45 and over were most often hospitalised for Other factors influencing health status.

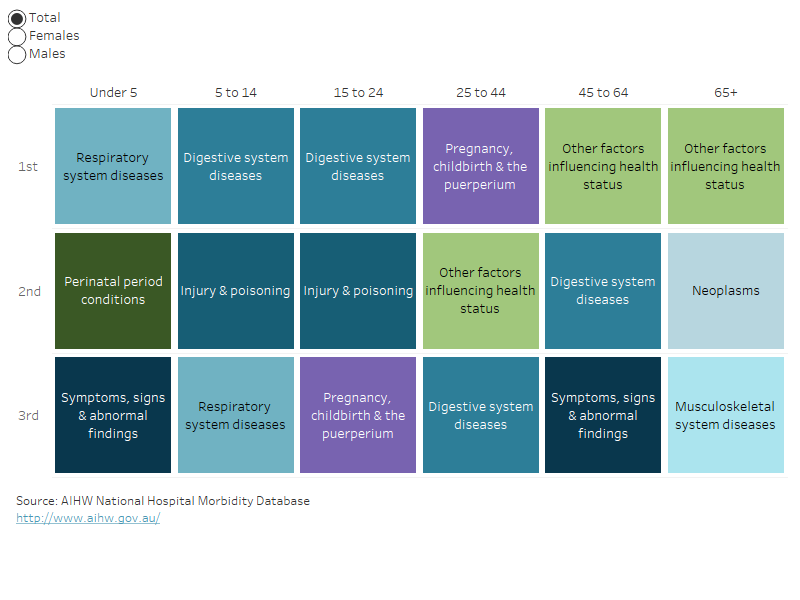
The table ranks the top 3 reasons for hospitalisation in 2021–22 by sex and age-group using the ICD-10-AM chapter. The top reason for hospitalisation for both males and females in the age-groups of 45 to 64 and 65+ was for ‘Other factors influencing health status’. ‘Injury and poisoning’ were the top reason for hospitalisation for males in the age groups 5 to 14 and 15 to 24. ‘Pregnancy, childbirth, and the puerperium’ were the top reason for hospitalisation for females in the age-groups 15 to 24 and 25 to 44. ‘Perinatal period conditions’ was the top reason for both males and females under 5.

Elective surgery activity

How many people are admitted from elective surgery waiting lists?

In 2022–23, 735,000 patients were admitted for surgery from public hospital elective surgery waiting lists – a 18% increase compared with 2021–22, and an average decrease of 0.8% per year since 2018–19.

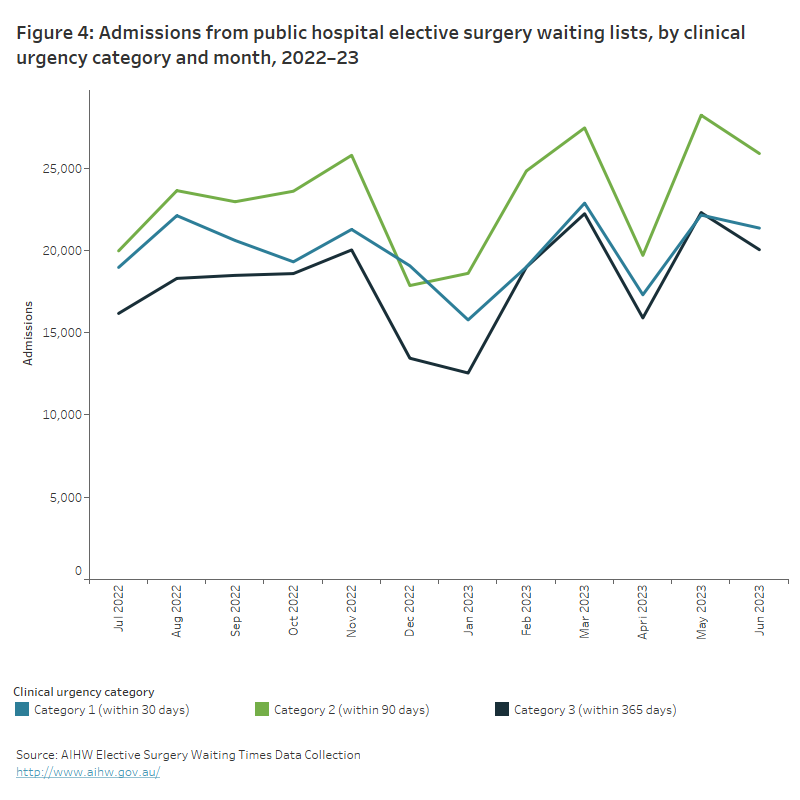
The line graph shows the number of admissions from public hospital elective surgery waiting lists for each month of the 2022–23 reporting year, disaggregated by clinical urgency category. Category 3 which are surgeries that need to be performed within 365 days have the lowest number of admissions throughout the entire reporting year compared to category 1 (within 30 days) and category 2 (within 90 days) surgeries. 

Non-admitted patient activity

How many services are provided in the outpatient setting?

Every year many Australians receive services via ‘outpatient’ or non-admitted patient clinics. These services are often associated with an emergency or admitted patient episode for which diagnostic or follow-up care is required without needing the person to be admitted to hospital.

In 2021–22, 55.4 million non-admitted patient care service events were provided for public patients.

This comprised of:

  • 20.8 million (38%) services provided in Allied health and/or clinical nurse specialist intervention clinics, which provide services by an allied health professional or clinical nurse specialist
  • 12.6 million (23%) services provided in Medical consultation clinics, which provide services by a medical or nurse practitioner and may include input from allied health personnel and/or clinical nurse specialists
  • 9.0 million (16%) services in Diagnostic service clinics, which provide imaging, screening, clinical measurement, and pathology
  • 12.9 million (23%) services in Procedural clinics, which provide minor surgical and non-surgical procedures (that do not require the patient to be admitted) by a surgeon or other medical specialist.

In the five years between 2017–18 and 2021–22, the number of service events increased by 16.5 million from 38.9 million to 55.4 million service events.

More information about the data

Emergency department care

Admitted patients

Elective surgery

Non-admitted patients