Waiting times
The data in this section relates to the waiting times of people who presented to the ED with a type of visit of Emergency presentation.
The progress of the patient through the ED is recorded using 5 different time points: presentation time, triage time, clinical care commencement, episode end time and physical departure time as depicted in Figure 1.
These can be used to calculate the waiting times for 50% and 90% of patients, as well as the proportion of patients seen on time.
The waiting time is calculated as the time between arrival at the ED and commencement of clinical care.
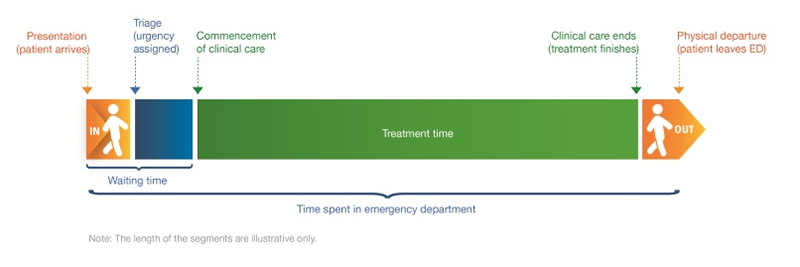
Figure 1: Measurement of time patients spend in emergency departments