Appendices
Appendix 1: Cost per NWAU, Comparable Cost of Care in public hospitals, 2011–12
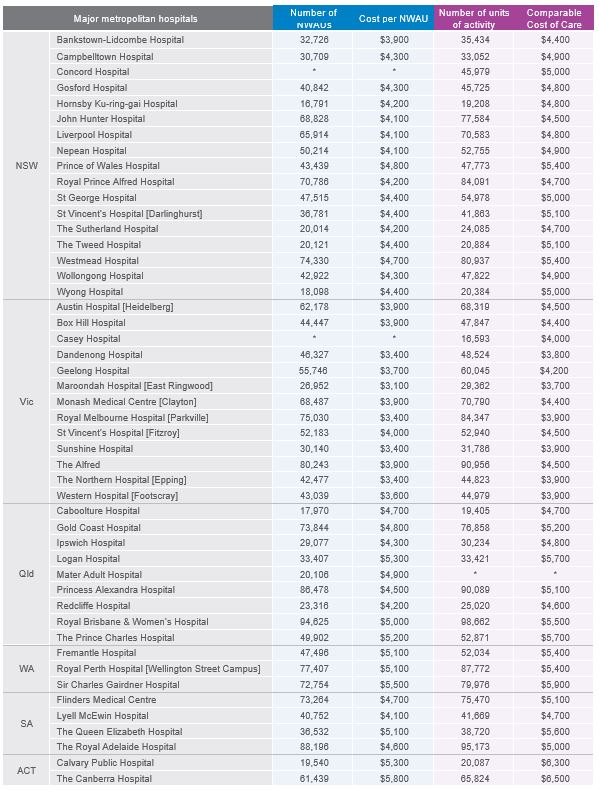
* In 2011–12, data for this hospital did not meet the minimum criteria to provide a result for Cost per NWAU or Comparable Cost of Care. Please refer to the Technical Supplement for more information on the minimum data requirements and inclusion criteria.
Sources:
National Health Performance Authority analysis of results calculated using the National Hospital Cost Data Collection 2011–12 and Admitted Patient Care National Minimum Dataset 2011–12.
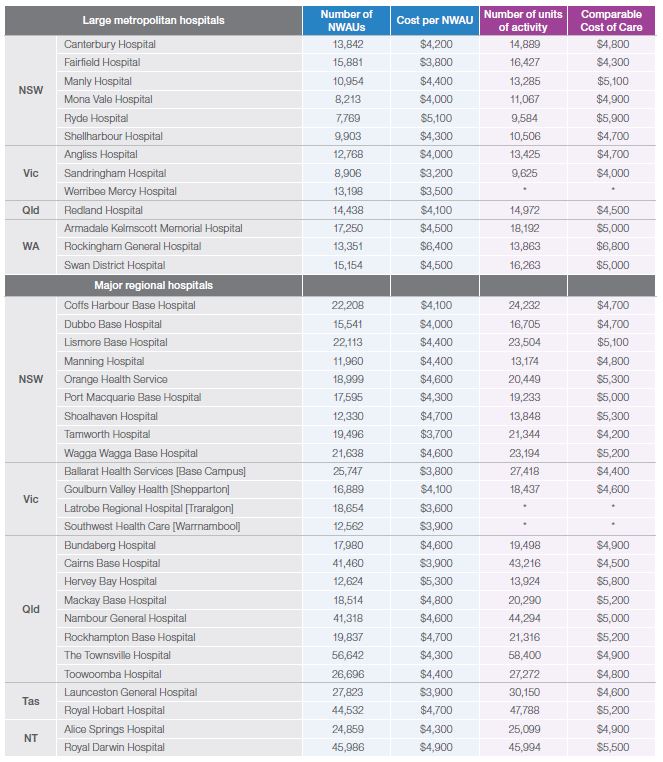
Appendix 2: Additional public hospitals for which results are available on the MyHospitals website
| Additional hospitals with results on the MyHospitals website* | |
|---|---|
| NSW | Bathurst Hospital |
| Goulburn Hospital | |
| Grafton Base Hospital | |
| Vic | Albury Wodonga Health [Wodonga Campus] |
| Bairnsdale Regional Health Service | |
| Central Gippsland Health Service [Sale] | |
| Mildura Base Hospital | |
| Northeast Health Wangaratta | |
| West Gippsland Healthcare Group [Warragul] | |
| Wimmera Base Hospital [Horsham] | |
| Tas | North West Regional Hospital |
* These hospitals have not been included in the main body of this report because they cannot reliably be used to support fair comparisons within peer groups for both measures.
Appendix 3: Distribution of the relative efficiency of major metropolitan, large metropolitan and major regional public hospitals using Comparable Cost of Care and Cost per NWAU, 2011–12
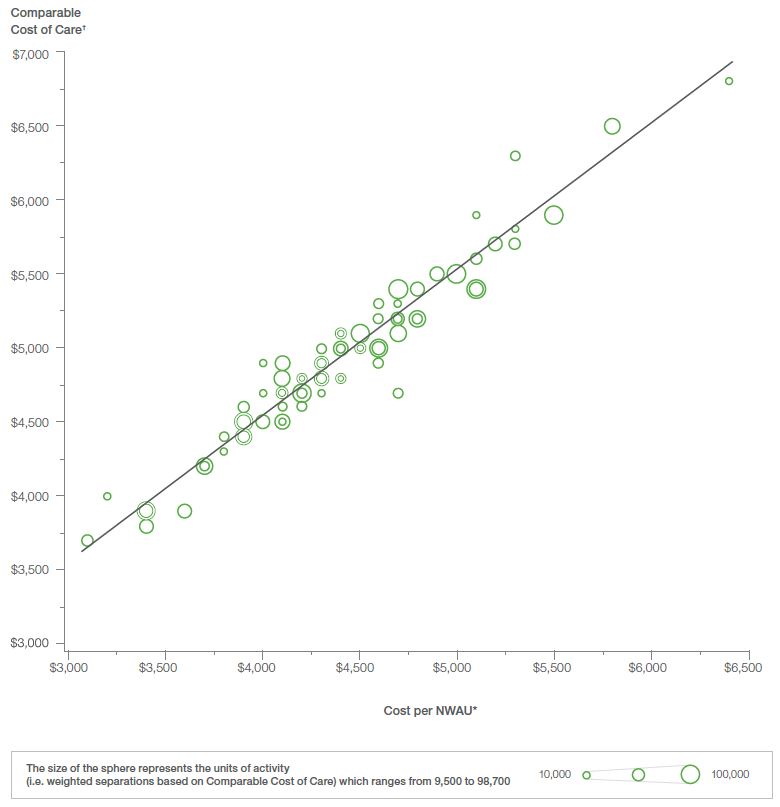
* The NWAU has been calculated using the National Efficient Price Determination 2014–15.
† The line of best fit has been calculated using all hospital results where Cost per NWAU and Comparable Cost of Care are available. Results for hospitals with less than eight hospitals in a peer group for both measures are not shown on the graph.
Sources:
National Health Performance Authority analysis of results calculated using the National Hospital Cost Data Collection 2011–12 and Admitted Patient Care National Minimum Dataset 2011–12.