Comparable Cost of Care
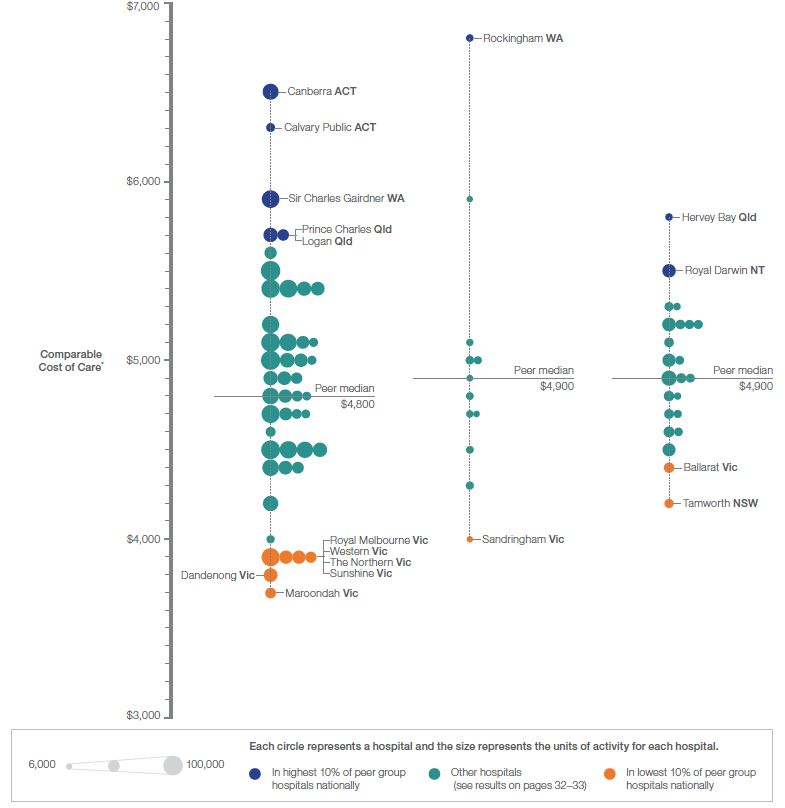
There was also considerable variation across major and large metropolitan and major regional hospitals nationally in terms of the Comparable Cost of Care, which also includes the costs of care provided in ED prior to admission. Results ranged from $3,700 to $6,800 in 2011–12 (Figure 3). Within the individual hospital peer groups, where comparisons are fairer and more meaningful, the ranges are shown below.
Across major metropolitan hospitals, the average Comparable Cost of Care was $4,900. The averages at individual hospitals within this peer group ranged from $3,700 at one hospital to $6,500 at another (76% higher).
| Top 10% of hospitals for this peer group | |
|---|---|
| The Canberra Hospital (ACT) | $6,500 |
| Calvary Public Hospital (ACT) | $6,300 |
| Sir Charles Gairdner Hospital (WA) | $5,900 |
| Logan Hospital (Qld) | $5,700 |
| The Prince Charles Hospital (Qld) | $5,700 |
Across large metropolitan hospitals, the average Comparable Cost of Care was $5,000. The averages at individual hospitals within this peer group ranged from $4,000 at one hospital to $6,800 at another hospital (71% higher).
| Bottom 10% of hospitals for this peer group | |
|---|---|
| Royal Melbourne Hospital [Parkville] (Vic) | $3,900 |
| Sunshine Hospital (Vic) | $3,900 |
| The Northern Hospital [Epping] (Vic) | $3,900 |
| Western Hospital [Footscray] (Vic) | $3,900 |
| Dandenong Campus (Vic) | $3,800 |
| Maroondah Hospital [East Ringwood] (Vic) | $3,700 |
Top 10% of hospitals in this peer group: | |
|---|---|
| Rockingham General Hospital (WA) | $6,800 |
Bottom 10% of hospitals in this peer group: | |
|---|---|
| Sandringham Hospital (Vic) | $4,000 |
Across major regional hospitals, the average Comparable Cost of Care was $4,900. The averages at individual hospitals within this peer group ranged from $4,200 at one hospital to $5,800 at another hospital (36% higher).
Top 10% of hospitals in this peer group | |
|---|---|
| Hervey Bay Hospital (Qld) | $5,800 |
| Royal Darwin Hospital (NT) | $5,500 |
Bottom 10% of hospitals in this peer group | |
|---|---|
| Ballarat Health Services [Base Campus] (Vic) | $4,400 |
| Tamworth Hospital (NSW) | $4,200 |
Figure 3 summarises the Comparable Cost of Care in 82 major and large metropolitan and major regional hospitals. Results for all these hospitals can be found in Appendix 1.
| Major metropolitan | Large metropolitan | Major regional | |
|---|---|---|---|
| Total peer group costs† | $12,131,660,200 | $805,871,900 | $3,061,599,700 |
| Total peer group units of activity‡ | 2,477,736 | 162,098 | 618,781 |
| Peer average Comparable Cost of Care | $4,900 | $5,000 | $4,900 |
* Comparable Cost of Care measures the relative efficiency of acute admitted patients, including the care provided in the Emergency Department prior to admission. It excludes property, plant and equipment costs. It includes the cost, types of patients and activity as defined by the Hospital Performance: Costs of acute admitted patients in public hospitals in 2011–12, Technical Supplement.
† Includes the costs as defined by Hospital Performance: Costs of acute admitted patients in public hospitals in 2011–12, Technical Supplement.
‡ A measure of a common unit of activity calculated as detailed in the Hospital Performance: Costs of acute admitted patients in public hospitals in 2011–12, Technical Supplement.
Sources:
National Health Performance Authority analysis of results calculated using the National Hospital Cost Data Collection 2011–12 and Admitted Patient Care National Minimum Dataset 2011–12.