Clients who have experienced family and domestic violence
On this page
In Australia, 1 in 6 women (17% or 1.6 million) and 1 in 16 men (6% or 548,000) have experienced physical or sexual violence from a current or previous cohabiting partner since the age of 15 (ABS 2017). Approximately 2.5 million Australian adults (13%) experienced abuse during their childhood; the majority knew the perpetrator and experienced multiple incidents of abuse (ABS 2017). Family and domestic violence affects people of all ages and from all backgrounds, but it predominantly affects women and children (AIHW 2019).
Family and domestic violence is the main reason women and children leave their homes in Australia (FaHCSIA 2008), with those who have experienced family and domestic violence making up 41% of Specialist Homelessness Services (SHS) clients in 2019–20 (see Clients, services and outcomes). Family and domestic violence has been found to disrupt housing security and is the leading cause of homelessness for women. In February 2019, the Australian Government announced $78 million for the Safe Places package to provide safe places for people impacted by family and domestic violence. Safe places will provide new or expanded emergency and crisis accommodation for women and children experiencing family and domestic violence. This program aims to build up to 450 safe places and assist up to 6,500 women and children escaping family and domestic violence each year (DSS 2020).
SHS agencies provide the principal crisis response for women and children who have to leave their home due to violence, yet data suggests that for many there is little services can do to provide a pathway into stable, secure, long-term housing (Flanagan et al. 2019). Women and children affected by family and domestic violence are a national priority cohort in the National Housing and Homelessness Agreement, which came into effect on 1 July 2018 (CFFR 2019) (see Policy section for more information). Effective services are required that recognise the impact of trauma and violence and the need for support in a safe and respectful environment (Flinders 2008). In order to achieve long term housing stability for those leaving a family and domestic violence situation, SHS responses often need to encompass a broad range of interventions and integrate various services and supports (Flanagan et al. 2019).
Reporting clients experiencing family and domestic violence in the Specialist Homelessness Services Collection (SHSC)
In the SHSC, a client is reported as experiencing family and domestic violence if in any support period during the reporting period the client sought assistance as a result of physical or emotional abuse inflicted on the client by a family member or if as part of any support period a person required family or domestic violence assistance.
The SHSC reports on clients experiencing family and domestic violence of any age, including both victims and a smaller number perpetrators who may be assisted by SHS agencies. Changes made to the SHSC allows for disaggregation of victim and/or perpetrators services. However, for 2019–20, this disaggregation will not occur due to data quality concerns that are common in the first reporting period after implementation. For more information, see Technical information.
Key findings
- In 2019–20, 119,200 SHS clients had experienced family and domestic violence, equating to 41% of all clients.
- Females made up the majority (90%) of adult (aged 18 years and over) SHS clients having experienced family and domestic violence.
- Half (51%) of all younger SHS clients (aged under 18) had experienced family and domestic violence.
- More SHS clients who experienced family and domestic violence were at risk of homelessness (63%) upon presentation to an SHS agency, than were homeless (37%).
- On average, each client who experienced family and domestic violence received assistance twice from homelessness agencies over the 12 month period (2 support periods per client), with a median of 52 days of support provided.
- The largest change to housing situation at the end of service provision was for clients in public or community housing—increasing from 16% of clients at the start of support to 22% at the end of support.
Data quality statement note:
From 2017–18 to 2018–19, there was a three per cent decrease in the total number of Victorian homelessness clients and a 10 per cent decrease in family violence clients following years of steady increases in these numbers. The decrease was primarily due to a practice correction in how some family violence agencies were recording clients. In addition, during 2018–19, a phased process to shift family violence intake to non-SHS services began, which may result in an overall decrease in the number of SHS family violence clients over the coming years. Caution should be used when comparing Victorian client numbers over recent years. For more information, see 2018–19 SHS Data Quality Statement.
Client characteristics
In 2019–20 (Table FDV.1):
- SHS agencies assisted around 119,200 clients (of any age) who experienced family and domestic violence. This equates to 41% of the almost 290,500 SHS clients in 2019–20.
- There was an increase of around 2,800 SHS clients seeking assistance for family and domestic violence compared with 2018–19.
- The rate of SHS clients who experienced family and domestic violence was 47.0 per 10,000 population, an increase from 44.3 in 2015–16.
|
|
2015–16 |
2016–17 |
2017–18 |
2018–19 |
2019–20 |
|---|---|---|---|---|---|
|
Number of clients |
105,619 |
114,757 |
121,116 |
116,419 |
119,182 |
|
Proportion of all clients |
38 |
40 |
42 |
40 |
41 |
|
Rate (per 10,000 population) |
44.3 |
47.4 |
49.2 |
46.6 |
47.0 |
Notes:
- Rates are crude rates based on the Australian estimated resident population (ERP) at 30 June of the reference year. Minor adjustments in rates may occur between publications reflecting revision of the estimated resident population by the Australian Bureau of Statistics.
- Data for 2015–16 to 2016–17 have been adjusted for non-response. Due to improvements in the rates of agency participation and SLK validity, data from 2017–18 are not weighted. The removal of weighting does not constitute a break in time series and weighted data from 2015–16 to 2016–17 are comparable with unweighted data for 2017–18 onwards. For further information, please refer to the Technical Notes.
- From 2017–18 to 2018-19 there was a 3% decrease in the number of Victorian homelessness clients and a 10% decrease in family violence clients following years of steady increase. The decrease was primarily due to a practice correction in how some family violence agencies were recording clients. In addition, during 2018–19, a phased process to shift family violence intake to non-SHS services began, which may result in an overall decrease in the number of SHS family violence clients over the coming years.
Source: Specialist Homelessness Services Collection 2015–16 to 2019–20.
Age and sex
In 2019–20, clients who experienced family and domestic violence (Supplementary table FDV.1):
- were younger than all SHS clients, with over 1 in 3 (36%) aged less than 18 years; 1 in 3 (32%) aged 18 to 34, and 1 in 3 (32%) aged 35 and over.
- Of the adults, most were female (9 in 10 or 90% adult SHS clients (aged 18 years and over).
- There was very little difference in the number and proportion of males (17,900 or 49%) and females (18,700 or 51%) aged under 15 experiencing family and domestic violence.
Indigenous clients
In 2019–20, of all Indigenous clients (around 71,600 clients) (Supplementary table INDIGENOUS.1, FDV.8):
- 2 in 5 clients (39% or almost 27,900 clients) had experienced family and domestic violence.
- 3 in 10 (28%) who had experienced family and domestic violence were less than 10 years of age.
State and territory
In 2019–20:
- Victoria had the highest number of SHS clients who experienced family and domestic violence (53,200 clients).
- New South Wales had the second highest number of clients who experienced family and domestic violence at almost 27,500 (23% of clients or 33.9 per 10,000 population). NSW was 1 of 4 states reporting a decrease in numbers of clients experiencing family and domestic violence; a decrease of 400 clients since 2018–19.
- While recording one of the lowest number (4,500 clients or 4%) of family and domestic violence clients in Australia, the Northern Territory had the highest rate of clients at 183.5 clients per 10,000 population.
Housing situation on first presentation
At the beginning of the first support period more than one-third (37%) of all clients who had experienced family and domestic violence presented to services experiencing homelessness, while 63% were at risk of homelessness (Supplementary table CLIENTS.12).
Presenting unit
Children experiencing family and domestic violence may seek SHS support with their family, or independently if fleeing the home. For children in particular, SHS support is critical to reduce the likelihood of a long term experience/risk of homelessness (Kaleveld et al 2018).
In 2019–20, clients who experienced family or domestic violence most commonly presented to a specialist homelessness agency for support alone or not as part of a family (53% or 63,600 clients), or as a single parent with child/ren (43% or almost 51,600 clients) (Supplementary table FDV.9).
Living arrangements
In 2019–20, of the 105,100 clients who experienced family and domestic violence and stated their living arrangement at the beginning of SHS support (Supplementary table FDV.10):
- nearly half (48% or almost 50,000 clients) were living as a single parent with one or more children
- 1 in 5 (19% or more than 19,700 clients) were living alone
- almost 13,600 people (13%) were living with other family, which can mean a person with or without children living (in a couch surfing arrangement) with others.
New or returning clients
In 2019–20 (Supplementary table FDV.7):
- Of the 119,200 SHS clients (of all ages) who experienced family and domestic violence, 44% were new SHS clients and 56% were returning clients, that is, had previously been assisted by a SHS agency at some point since the collection began in 2011–12. This does not mean that when these people were SHS clients in the past they were experiencing family and domestic violence.
- Of the new clients, 44% (23,000 clients) were aged under 18, 50% were aged 18–55, and 6% were aged 55 and over. By contrast, of the returning clients, fewer (20,000 clients or 30%) were under 18.
Selected vulnerabilities
People who experience family and domestic violence may experience other vulnerabilities to experiencing homelessness, such as a current mental health issue and/or problematic drug and/or alcohol use. In 2019–20, of the 91,700 clients aged 10 and over who experienced family and domestic violence (Table FDV.2):
- almost 6 in 10 (58% or more than 53,500 clients) did not report experiencing an additional vulnerability
- 3 in 10 clients (30% or 27,100 clients) also reported a current mental health issue
- 1 in 10 clients (10% or almost 8,700 clients) reported 3 key vulnerabilities (family and domestic violence, current mental health issues and problematic drug and/or alcohol use).
|
Family and domestic violence |
Mental health issue |
Problematic drug and |
Clients |
Per cent |
|---|---|---|---|---|
|
Yes |
Yes |
Yes |
8,684 |
9.5 |
|
Yes |
Yes |
No |
27,099 |
29.6 |
|
Yes |
No |
Yes |
2,368 |
2.6 |
|
Yes |
No |
No |
53,537 |
58.4 |
|
|
|
|
91,688 |
100.0 |
Notes
- Clients are assigned to one category only based on their vulnerability profile.
- Clients are aged 10 and over.
- Totals may not sum due to rounding.
Source: Specialist Homelessness Services Collection 2019–20.
Service use patterns
In 2019–20, clients who had experienced family and domestic violence received (Table FDV.3):
- a median of 52 days of support, up from 38 days in 2015–16
- an average of 2.0 support periods per client
- a median 29 nights of accommodation.
|
|
2015–16 |
2016–17 |
2017–18 |
2018–19 |
2019–20 |
|---|---|---|---|---|---|
|
Length of support (median number of days) |
38 |
39 |
43 |
54 |
52 |
|
Average number of support periods per client |
1.9 |
1.9 |
2.0 |
2.0 |
2.0 |
|
Proportion receiving accommodation |
39 |
37 |
35 |
36 |
35 |
|
Median number of nights accommodated |
31 |
31 |
31 |
30 |
29 |
Notes:
- The denominator for the proportion receiving accommodation is all SHS clients who have experienced family and domestic violence. Denominator values for proportions are provided in the relevant supplementary table.
- Data for 2015–16 to 2016–17 have been adjusted for non-response. Due to improvements in the rates of agency participation and SLK validity, data from 2017–18 are not weighted. The removal of weighting does not constitute a break in time series and weighted data from 2015–16 to 2016–17 are comparable with unweighted data for 2017–18 onwards. For further information, please refer to the Technical Notes.
Source: Specialist Homelessness Services Collection 2015–16 to 2019–20.
Main reasons for seeking assistance
In 2019–20, of those SHS clients who experienced family and domestic violence:
- 7 in 10 clients (69%) identified family and domestic violence as the main reason for accessing SHS services, while a further 8% identified housing crisis (Supplementary table FDV.5).
- For clients presenting at risk of homelessness, the most common main reasons for seeking assistance were (Supplementary table FDV.6):
- family and domestic violence (75%)
- housing crisis (6%)
- financial difficulties (4%).
- For clients presenting as homeless, the most common main reasons for seeking assistance were (Supplementary table FDV.6):
- family and domestic violence (53%)
- housing crisis (14%)
- inadequate or inappropriate dwelling conditions (10%).
Services needed and provided
In 2019–20, 88,100 (74%) SHS clients who experienced family and domestic violence needed specific assistance for this reason, including therapeutic discussion or group sessions, counselling and specialised support services. Of those needing assistance for family and domestic violence, 89% were provided this assistance (Figure FDV.1).
The next most common services requested by this client group were:
- short-term or emergency accommodation (42% or over 49,500), with 69% of those needing this service, receiving this service
- material aid/brokerage (39% or 46,600), with 87% of those needing this service receiving this service
- long-term housing (33% or over 39,400), with 3% of those needing this service receiving this service and a further 28% referred.
Figure FDV.1: Clients who have experienced family and domestic violence, by need for services and assistance and service provision status (top 6), 2019–20
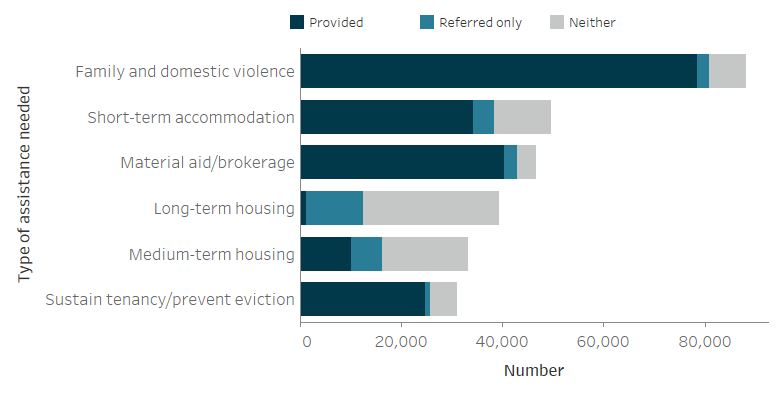
Notes
- Excludes 'Other basic assistance'. 'Advice/information' and 'Advocacy/liaison on behalf of client'.
- 'Short-term accommodation' includes temporary and emergency accommodation.
- 'Neither' indicates a service was neither provided nor referred.
Source: Specialist Homelessness Services Collection 2019–20, Supplementary table FDV.3.
The proportion of SHS clients who have experienced family and domestic violence with a case management plan has remained comparatively high over time (69% in 2019–20); however those achieving all case management goals has remained low (18% in 2019–20) (Supplementary table CLIENTS.35).
Outcomes at the end of support
Outcomes presented here describe the change in clients’ housing situation between the start and end of support. Data is limited to clients who ceased receiving support during the financial year—meaning that their support periods had closed and they did not have ongoing support at the end of the year.
Many clients had long periods of support or even multiple support periods during 2019–20. They may have had a number of changes in their housing situation over the course of their support. These changes within the year are not reflected in the data presented here, rather the client situation at the start of their first support period in 2019–20 is compared with the end of their last support period in 2019–20. A proportion of these clients may have sought assistance prior to 2019–20, and may again in the future.
At the end of the reporting period in 2019–20 (Table FDV.4):
- Just over 6 in 10 clients experiencing family and domestic violence presented to agencies known to be housed (61% or 41,500 clients), and by the end of support this had risen to over 7 in 10 (72% or 48,700). Much of the increase can be attributed to more clients living in public or community housing; an increase from 16% to 22% by the end of support.
- The most common housing situation for clients experiencing family and domestic violence at both the start and end of SHS support was private or other housing; 29,600 clients (43%) at the start, increasing to 33,200 (49%) at the end of SHS support.
- At the end of support, almost 3 in 10 clients experiencing family and domestic violence were known to be experiencing homelessness (28% or 18,600 clients). Compared with the start of support, there were 8,000 fewer clients experiencing homelessness; down from 26,700 clients (39%).
- Clients experiencing family and domestic violence known to be homeless were more likely to present to agencies while living in short term temporary accommodation (20% or 13,900 clients). This was the most common housing situation for those experiencing homelessness, and remained so at the end of support (16% or 10,500 clients living in short term temporary accommodation).
These findings demonstrate that by the end of support, there was a reduction in homeless housing circumstances and an increase in other, potentially more positive, housing solutions. That is, more clients ended support in public or community housing (renter or rent-free) or private or other housing (renter or rent-free) compared with the start of support.
|
Housing situation |
Beginning of support |
End of |
Beginning of support |
End of |
|---|---|---|---|---|
|
No shelter or improvised/inadequate dwelling |
3,479 |
1,878 |
5.1 |
2.8 |
|
Short term temporary accommodation |
13,850 |
10,493 |
20.3 |
15.6 |
|
House, townhouse or flat - couch surfer or with no tenure |
9,333 |
6,224 |
13.7 |
9.2 |
|
Total homeless |
26,662 |
18,595 |
39.1 |
27.6 |
|
Public or community housing - renter or rent free |
10,973 |
14,781 |
16.1 |
22.0 |
|
Private or other housing - renter, rent free or owner |
29,591 |
33,235 |
43.4 |
49.4 |
|
Institutional settings |
944 |
680 |
1.4 |
1.0 |
|
Total at risk |
41,508 |
48,696 |
60.9 |
72.4 |
|
Total clients with known housing situation |
68,170 |
67,291 |
100.0 |
100.0 |
|
Not stated/other |
20,967 |
21,846 |
|
|
|
Total clients |
89,137 |
89,137 |
|
|
Notes:
- Percentages have been calculated using total number of clients as the denominator (less not stated/other).
- It is important to note that individual clients beginning support in one housing type need not necessarily be the same individuals ending support in that housing type.
- Not stated/other includes those clients whose housing situation at either the beginning or end of support was unknown.
Source: Specialist Homelessness Services Collection. Supplementary table FDV.4.
Housing outcomes for homeless versus at risk clients
For clients with a known housing status who were at risk of homelessness at the start of support (more than 38,600 clients), by the end of support (Figure FDV.2):
- Most (23,800 clients or 62%) were in private housing.
- Around 10,200 clients (26%) were in public housing.
A smaller number were experiencing homelessness at the end of support (around 4,300 clients or 11% of those who started support at risk).
Figure FDV.2: Housing situation for clients with closed support who began support at risk of homelessness, 2019–20
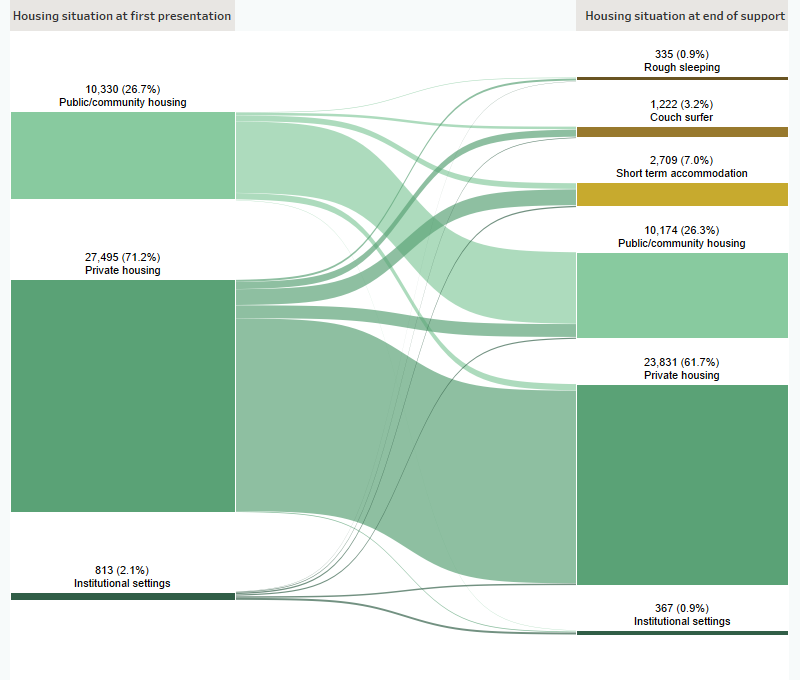
Notes:
- Excludes clients with unknown housing situation.
- Includes only those clients who ceased receiving support during the financial year (meaning that their support period(s) had closed and they were not in ongoing support at the end of the year)/
Source: Specialist Homelessness Services Collection, 2019–20
For clients who were known to be homeless at the start of support (just over 23,900 clients), agencies were able to assist (Figure FDV.3):
- 7,100 clients (30%) into short term accommodation
- 6,800 (28%) into private housing.
A further 4,600 clients (19%) were couch surfing at the end of support.
Figure FDV.3: Housing situation for clients with closed support who were experiencing homelessness at the start of support, 2019–20
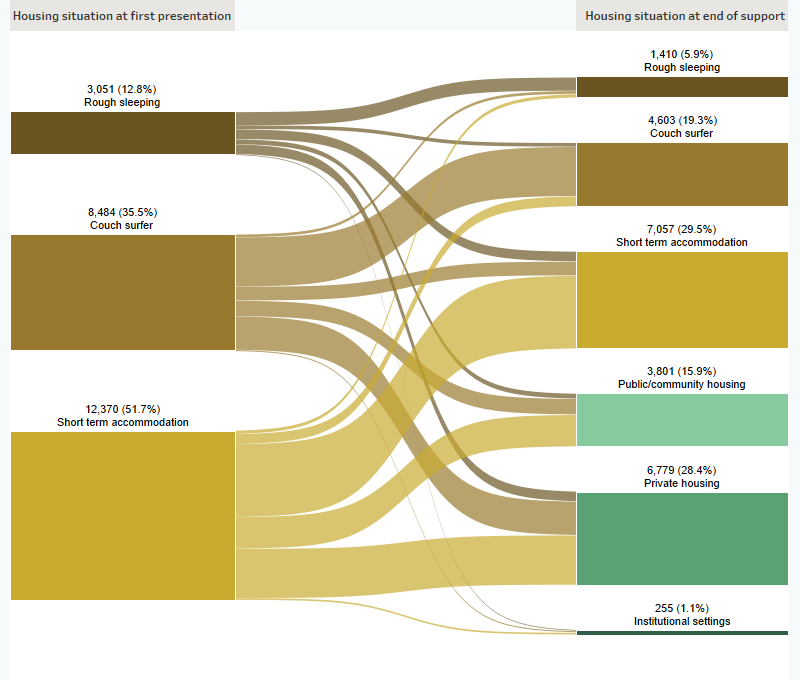
Notes:
- Excludes clients with unknown housing situation.
- Includes only those clients who ceased receiving support during the financial year (meaning that their support period(s) had closed and they were not in ongoing support at the end of the year).
Source: Specialist Homelessness Services Collection, 2019–20
Clients accessing SHS agencies who have experienced family and domestic violence have some notable differences from other client groups. Compared with other client groups, more clients who experienced family and domestic violence were in private housing at the start and end of SHS support. Perhaps driven by their greater likelihood of presenting while housed, their service use patterns were considerably less than other client groups and they were less likely to need accommodation overall. Short-term accommodation was their greatest housing need which is in contrast to other groups which often needed long-term housing the most. This client group was more likely to be new, rather than returning clients, and more likely to experience only one selected vulnerability (family and domestic violence).
It is important to note that this analysis is based on the almost 119,200 clients of SHS agencies in 2019–20. While there are various support services available, many people do not seek advice or support after incidents of family or domestic violence. Other research suggests that for those who experienced physical and/or sexual violence from a current cohabiting partner, 1 in 2 women never sought advice or support (AIHW 2019).
People fleeing violence often require safe, affordable, independent housing in which to live in the long term and yet, some are unable to secure it (Flanagan 2019). In the absence of an appropriate housing solution, some people may consider returning to a violent relationship (Flanagan 2019). While the availability of long-term housing is a key challenge for SHS clients overall, it is particularly so for this large client group.
References
ABS (Australian Bureau of Statistics) 2017. Personal Safety, Australia, 2016. ABS cat. no. 4906.0 Canberra: ABS.
AIHW (Australian Institute of Health and Welfare) 2019. Family, domestic and sexual violence in Australia: continuing the national story 2019. Cat. no: FDV 2 Canberra: AIHW.
CFFR (Council on Federal Financial Relations) National Housing and Homelessness Agreement. 2018. Viewed 18 September 2019.
DSS (Department of Social Services) 2020. Safe Places Emergency Accommodation Program (Safe Places). Viewed 6 October 2020.
Flanagan K, Blunden H, Valentine K & Henriette J 2019. Housing outcomes after domestic and family violence, AHURI Final Report 311, Australian Housing and Urban Research Institute Limited, Melbourne.
Flinders (Flinders University) Prepared for the Office for Women. Department of Families, Housing, Community Services and Indigenous Affairs. Tually S, Faulkner D, Cutler C and Slatter M 2008. Women, Domestic and Family Violence and Homelessness. A Synthesis Report.
Kaleveld L, Seivwright A, Box E, Callis Z & Flatau P 2018. Homelessness in Western Australia: A review of the research and statistical evidence. Perth: Government of Western Australia, Department of Communities. Viewed 27/06/2019.
Robinson C 2003. Understanding iterative homelessness: the case of people with mental disorders. AHURI Final Report No. 45, Australian Housing and Urban Research Institute. Melbourne.
Spinney A, 2012. Home and safe? Policy and practice innovations to prevent women and children who have experienced family and domestic violence from becoming homeless. AHURI Final report no. 196, Australian Housing and Urban Research Institute. Melbourne