Older clients
On this page
Older people are the fastest growing subpopulation of people experiencing homelessness and of people using homelessness services in Australia (AIHW 2019).
Australia and international research suggest that there are two main and contrasting pathways into homelessness for older people, each with different risk factors. Firstly, many people who experience homelessness for the first time later in life have led “conventional” lives (Shinn et al. cited in Petersen et al. 2014) involving employment, residential stability and family; these people only experienced homelessness after critical life events such as relationship breakdown, financial trouble or the onset of illness (Petersen et al. 2014). Three factors may be important for this subgroup, which is more often female, educated and in good health: (1) they have an element of financial insecurity, often because of a history of low paid or insecure work, (2) they are unfamiliar with health and welfare systems, (3) they may have a reluctance to draw on existing social capital (Burns and Sussman, 2018).
Secondly, there is also a population of older adults who have experienced long-term, or chronic, homelessness often with poor physical and mental health and histories of substance misuse and institutionalisation (Petersen et al. 2014). For this group, the pathway to homelessness is an ongoing issue, featuring repeated attempts to obtain assistance, long-term housing instability, little or no social capital and limited options before becoming homeless at later ages (Burns and Sussman, 2018).
Affecting both groups is the increasing cost of home ownership and of rental accommodation, which has resulted in fewer older Australians owning their own home (ABS 2019), and many older Australians on low incomes being unable to compete in rental markets (Nesbitt and Johnson, 2019). For older Australians who rely on government payments and live in private rental accommodation, rent increases or evictions are common risks for becoming homeless (Morris et al. 2005). Also relevant is a lack of age-specific services for older people as well as an unawareness of available services and, in some cases, an unwillingness to engage with services because of shame (Thredgold et al 2019).
When compared with other people at risk of experiencing homelessness, an Australian survey found that older respondents (45 years and over) were more likely to sleep rough than younger respondents and, when homeless, experience longer periods of homelessness (Bevitt et al 2015).
The experiences of older people accessing SHS for assistance have been investigated in detail in a recent AIHW report (AIHW 2019). For the purposes of the Specialist Homelessness Services Collection (SHSC), older people are defined as clients aged 55 years and over. For further information, see Technical information.
Key findings
- In 2019–20, there were about 24,400 people aged 55 years or older seeking homelessness services.
- The majority of older clients were living alone when they presented to SHS services (60%) and the proportion was higher for males (69%) than for females (53%).
- 2 in 3 older clients presented housed but at risk of homelessness (66%).
- More than half (54%) of older clients in 2019–20 were returning clients, that is, they had previously been assisted by a SHS agency at some point since the collection began in 2011–12.
- Housing outcomes for older clients improved; of those clients with closed support, 26% of older clients were known to be homeless at the end of support compared with 34% at the beginning.
- The proportion of ‘rough sleepers’ decreased from 11% at the beginning of support to 7% at the end of support in 2019–20.
- Most older clients known to be at risk of homelessness at the start of support were assisted to maintain a housing tenancy (94%).
Client characteristics
In 2019–20 (Table OLDER.1):
- SHS agencies assisted over 24,400 clients aged 55 and over. Since 2015–16, the number of clients aged 55 and over has risen by more than 3,800 clients.
- Older clients represented 8% of all SHS clients, which has been relatively stable since 2015–16.
- The rate of older clients increased from 8.6 per 10,000 Australian population in 2015–16 to 9.6 in 2019–20.
- The age specific rate of service use among older Australians was 54.0 clients per 10,000 population for those aged 55–64 and 21.3 per 10,000 for those aged 65 and over (Supplementary table CLIENTS.1).
|
|
2015–16 |
2016–17 |
2017–18 |
2018–19 |
2019–20 |
|---|---|---|---|---|---|
|
Number of clients |
20,579 |
22,443 |
24,094 |
24,169 |
24,421 |
|
Proportion of all clients |
7 |
8 |
8 |
8 |
8 |
|
Rate (per 10,000 population) |
8.6 |
9.3 |
9.8 |
9.7 |
9.6 |
Notes
- Rates are crude rates based on the Australian estimated resident population (ERP) at 30 June of the reference year. Minor adjustments in rates may occur between publications reflecting revision of the estimated resident population by the Australian Bureau of Statistics.
- Data for 2015–16 to 2016–17 have been adjusted for non-response. Due to improvements in the rates of agency participation and SLK validity, data from 2017–18 are not weighted. The removal of weighting does not constitute a break in time series and weighted data from 2015–16 to 2016–17 are comparable with unweighted data for 2017–18 onwards. For further information, please refer to the Technical Notes.
- In 2017–18, age and age-related variables were derived using a more robust calculation method. Data for previous years have been updated with the improved calculation method for age. As such, data prior to 2017–18 contained in the SHS Annual Report may not match that contained in the SHS Annual Report Historical Tables.
Source: Specialist Homelessness Services Collection 2015–16 to 2019–20.
Age and sex
Of the more than 24,400 older clients who received SHS support during 2019–20:
- Almost 2 in 3 (65%) were aged 55–64; the remaining one-third were 65 or over.
- More than half (55%) were female (Supplementary table OLDER.1).
Indigenous status
The proportion of clients 55 and over was lower for Indigenous clients (5% or 3,600) compared with non-Indigenous clients (9% or 18,600).
States and territories
In 2019–20:
- Victoria recorded the highest number of older SHS clients (more than 11,800), representing almost half (49%) of this client group in Australia (Supplementary table OLDER.2), followed by New South Wales with 5,000 clients (21%).
- While having one of the lowest number of older clients in Australia (nearly 700 or 3% of national total), the Northern Territory had the highest rate of clients, at 27 per 10,000 estimated resident population.
Labour force
- In 2019–20, the majority of older clients were not in the labour force (54%). Over one third (38%) were unemployed (that is, seeking work) and less than 1 in 10 (7%) were employed (Supplementary table OLDER.12).
- Of those who were in the labour force, female clients were more likely to be employed full-time (3%) and part-time (6%) than males (2% and 3%, respectively). Conversely, males clients (41%) were more likely to be unemployed than females (36%).
Living arrangements
In 2019–20, of the almost 22,100 clients who stated their living arrangement upon presentation to a SHS agency (Supplementary table OLDER.10):
- 6 in 10 (60% or 13,300 clients) were living alone; higher for males (69%) than females (53%)
- more than 1 in 10 (13% or 2,900 clients) were living as a lone parent or couple with children
- over 2,600 people (12%) were living with other family which can include a person with or without children living (as a couch surfing arrangement) with others.
Selected vulnerabilities
The majority of older clients (53% or 12,900) reported no vulnerabilities (defined as a current mental health issue, experiencing family and domestic violence, or problematic drug and/or alcohol use) (Table OLDER.2).
- 1 in 5 older clients (20% or almost 4,900 clients) reported a current mental health issue only
- 1 in 7 older clients (15% or nearly 3,800 clients) reported family and domestic violence only.
|
Family and domestic violence |
Mental health issue |
Problematic drug and |
Clients |
Per cent |
|---|---|---|---|---|
|
Yes |
Yes |
Yes |
225 |
0.9 |
|
Yes |
Yes |
No |
1,418 |
5.8 |
|
Yes |
No |
Yes |
105 |
0.4 |
|
No |
Yes |
Yes |
743 |
3.0 |
|
Yes |
No |
No |
3,756 |
15.4 |
|
No |
Yes |
No |
4,863 |
19.9 |
|
No |
No |
Yes |
443 |
1.8 |
|
No |
No |
No |
12,868 |
52.7 |
|
|
|
|
24,421 |
100.0 |
Notes
- Clients are assigned to one category only based on their vulnerability profile.
- Clients are aged 55 and over.
- Totals may not sum due to rounding.
Source: Specialist Homelessness Services Collection 2019–20.
Service use patterns
Since 2015–16, the number of older clients seeking assistance from SHS agencies increased at a greater rate than other age groups. Key trends identified in this client population over the 5 years to 2019–20 are (Table OLDER.3):
- The median number of days older clients received support increased from 25 days in 2015–16 to 32 days in 2019–20.
|
|
2015–16 |
2016–17 |
2017–18 |
2018–19 |
2019–20 |
|---|---|---|---|---|---|
|
Length of support (median number of days) |
25 |
27 |
28 |
31 |
32 |
|
Average number of support periods per client |
1.5 |
1.5 |
1.6 |
1.6 |
1.6 |
|
Proportion receiving accommodation |
17 |
17 |
16 |
17 |
18 |
|
Median number of nights accommodated |
31 |
30 |
29 |
22 |
21 |
Notes
- The denominator for the proportion receiving accommodation is all older SHS clients. Denominator values for proportions are provided in the relevant supplementary table.
- Data for 2015–16 to 2016–17 have been adjusted for non-response. Due to improvements in the rates of agency participation and SLK validity, data from 2017–18 are not weighted. The removal of weighting does not constitute a break in time series and weighted data from 2015–16 to 2016–17 are comparable with unweighted data for 2017–18 onwards. For further information, please refer to the Technical Notes.
- In 2017–18, age and age-related variables were derived using a more robust calculation method. Data for previous years have been updated with the improved calculation method for age. As such, data prior to 2017–18 contained in the SHS Annual Report may not match that contained in the SHS Annual Report Historical Tables.
Source: Specialist Homelessness Services Collection 2015–16 to 2019–20.
New or returning clients
More than half (54% or 13,300) were returning clients, having previously been assisted by a SHS agency at some point since the collection began in 2011–12 (Supplementary table OLDER.7). A greater proportion of returning clients were aged 55-64 (69% compare with 31% aged 65 and over) than were new clients (60% were aged 55 to 64 years).
Main reasons for seeking assistance
The 3 main reasons why older clients sought assistance from SHS agencies in 2019–20 were (Supplementary table OLDER.5):
- housing crisis (18% or 4,300 clients)
- financial difficulties (17% or 4,200)
- family and domestic violence (17% or 4,100).
The main reason for older clients seeking assistance was different for those experiencing homelessness compared with those presenting to services at risk of homelessness (Supplementary table OLDER.6).
- For those experiencing homelessness the main reasons for seeking assistance were:
- housing crisis (24% or nearly 1,900 clients)
- inadequate or inappropriate dwelling conditions (23% or nearly 1,800)
- financial difficulties (10% or 800).
- For those at risk of homelessness:
- financial difficulties (20% or 2,900 clients)
- family and domestic violence (18% or 2,700)
- housing crisis (16% or 2,400).
Services needed and provided
In 2019–20, over half (51% or 12,500) of older SHS clients needed accommodation, of those 36% were provided with some type of accommodation assistance. Demand was highest for long-term accommodation (39% or 9,600 needed long-term accommodation) compared with medium-term (21% or 5,100) and short-term or emergency accommodation (27% or 6,600). Of the older clients that needed long-term housing, less than 1 in 15 (6%) were provided assistance (Figure OLDER.1).
Other services most commonly needed by older clients during 2019–20 were:
- assistance to sustain tenancy or prevent tenancy failure or eviction (35%), with 83% provided this assistance
- material aid/brokerage (31%), with 86% provided this assistance
- financial information (19%), with 84% provided with assistance.
Figure OLDER.1: Older clients, by most needed services and service provision status (top 6), 2019–20
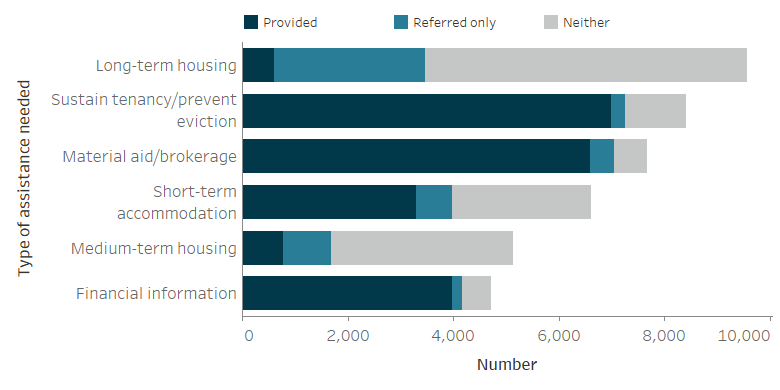
Notes
- Excludes 'Other basic assistance', 'Advice/information' and 'Advocacy/liaison on behalf of client'.
- 'Short-term accommodation' includes temporary and emergency accommodation and sustain tenancy/prevent eviction includes assistance to sustain tenancy or prevent tenancy failure or eviction.
- 'Neither' indicates a service was neither provided nor referred.
Source: Specialist Homelessness Services Collection 2019–20, Supplementary table OLDER.3.
Outcomes at the end of support
Outcomes presented here describe the change in clients’ housing situation between the start and end of support. Data are limited to clients who ceased receiving support during the financial year—meaning that their support periods had closed and they did not have ongoing support at the end of the year.
Many clients had long periods of support or even multiple support periods during 2019–20. They may have had a number of changes in their housing situation over the course of their support. These changes within the year are not reflected in the data presented here. Instead, the client situation at the start of their first support period in 2019–20 is compared with the end of their last support period in 2019–20. A proportion of these clients may have sought assistance prior to 2019–20, and may again in the future.
At the end of the reporting period in 2019–20 (Table OLDER.4).
- 1 in 4 (26% or 4,200) were known to be homeless when support ended, down from 34% at the start of support.
- The reduction in the proportion of clients who were known to be homeless following support was due to decreases in the proportion of clients rough sleeping or with no shelter or living in improvised dwellings (from 11% to 7%) and in the proportion of clients living in a house, townhouse or flat as a ‘couch surfer’, with no tenure (from 11% to 8%).
- Clients living in public or community housing increased following support; there was an increase in clients living in some form of tenure over the course of support, including an increase in the proportion of clients living in public or community housing from 22% to 29% (or more than 4,700 clients).
|
Housing situation |
Beginning of support |
End of |
Beginning of support |
End of |
|---|---|---|---|---|
|
No shelter or improvised/inadequate dwelling |
1,842 |
1,109 |
11.2 |
6.8 |
|
Short term temporary accommodation |
1,975 |
1,873 |
12.0 |
11.5 |
|
House, townhouse or flat - couch surfer or with no tenure |
1,771 |
1,221 |
10.8 |
7.5 |
|
Total homeless |
5,588 |
4,203 |
34.0 |
25.7 |
|
Public or community housing - renter or rent free |
3,545 |
4,713 |
21.6 |
28.8 |
|
Private or other housing - renter, rent free or owner |
6,737 |
6,975 |
41.0 |
42.7 |
|
Institutional settings |
547 |
457 |
3.3 |
2.8 |
|
Total at risk |
10,829 |
12,145 |
66.0 |
74.3 |
|
Total clients with known housing situation |
16,417 |
16,348 |
100.0 |
100.0 |
|
Not stated/other |
2,930 |
2,999 |
|
|
|
Total clients |
19,347 |
19,347 |
|
|
Notes
- Percentages have been calculated using total number of clients as the denominator (less not stated/other).
- It is important to note that individual clients beginning support in one housing type need not necessarily be the same individuals ending support in that housing type.
Source: Specialist Homelessness Services Collection 2015–16 to 2019–20.
Housing outcomes for homeless verses at risk clients
For clients with a known housing status who were at risk of homelessness at the start of support (over 10,500 clients), by the end of support (Supplementary Table OLDER.4, Figure OLDER.2):
- Most clients (5,900 clients or 56%) were in private or other housing
- Around 3,700 clients (35%) were in public or community housing
- 620 clients were experiencing homelessness at the end of support (6% of those who started support at risk).
Figure OLDER.2: Housing situation for clients with closed support who began support at risk of homelessness, 2019–20
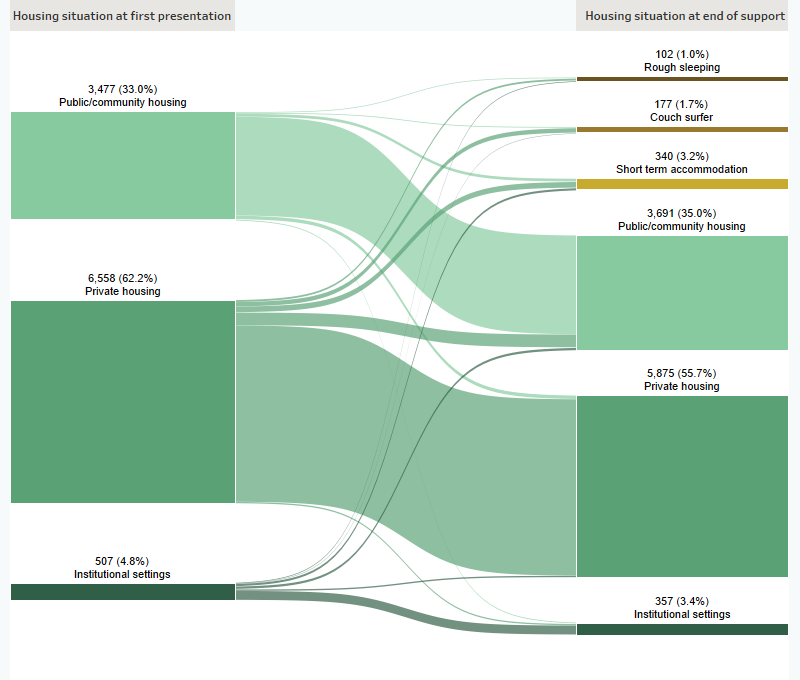
Notes
- Excludes client with unknown housing situation.
- Includes only those clients who ceased receiving support during the financial year (meaning their support period(s) had closed and they were not in ongoing support at the end of the year).
Source: Specialist Homelessness Services Collection, 2019–20
For clients who were known to be homeless at the start of support (over 5,200 clients) (Figure OLDER.3):
- 1,400 clients (27%) were in short term accommodation at the end of support
- 850 clients (16%) were in private or other housing at the end of support.
- One in five clients (1,000 or 19%) were couch surfing at the end of support.
Figure OLDER.3: Housing situation for clients with closed support who were experiencing homelessness at the start of support, 2019–20
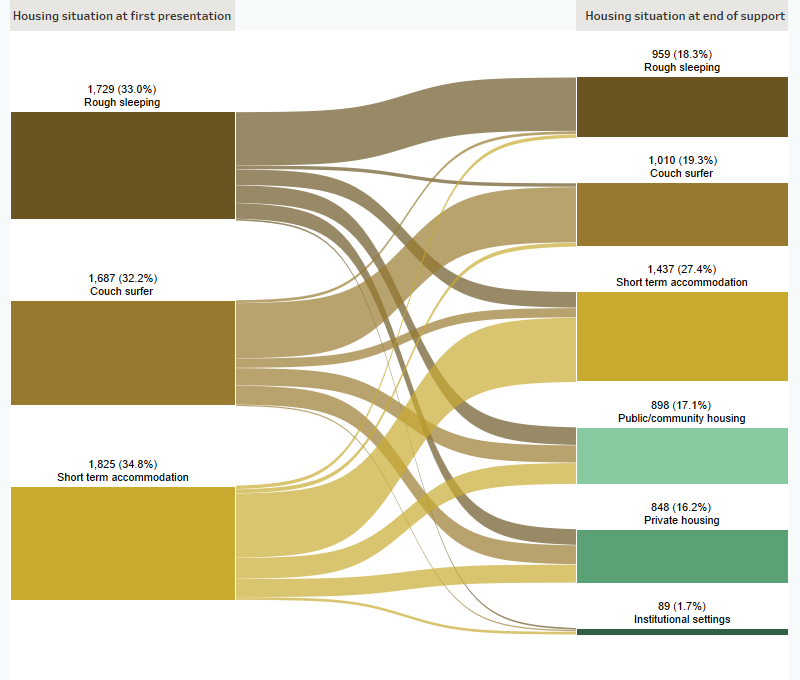
Notes
- Excludes client with unknown housing situation.
- Includes only those clients who ceased receiving support during the financial year (meaning their support period(s) had closed and they were not in ongoing support at the end of the year).
Source: Specialist Homelessness Services Collection, 2019–20
References
ABS (Australian Bureau of Statistics) 2019. Housing occupancy and costs, Australia, 2017–18. ABS Cat. no. 4130.0. Canberra: ABS.
AIHW (Australian Institute of Health and Welfare) 2019. Older clients of specialist homelessness services. AIHW Cat. no. HOU 314. Canberra: Australian Institute of Health and Welfare.
Bevitt A, Chigavazira A, Herault N, Johnson G, Moschion J, Scutella R et al. 2015. ![]() Journeys home research report No. 6: Complete findings from waves 1 to 6. Melbourne: Melbourne Institute of Applied Economic and Social Policy.
Journeys home research report No. 6: Complete findings from waves 1 to 6. Melbourne: Melbourne Institute of Applied Economic and Social Policy.
Burns VF, Sussman T 2019. Homeless for the first time in later life: uncovering more than one pathway. The Gerontologist, vol. 59, issue 2: 251–259.
Morris A, Judd B, Kavanagh K 2005. Marginality amidst plenty: pathways into homelessness for older Australians. Australian Journal of Social Issues, vol. 40, issue 2: 241-251.
Nesbitt O & Johnson L 2019. ![]() Homeless at home? Analysing the housing needs and insecurities of single, older, non-homeowning women. UQ|UP Research Paper no. 2/2019. Brisbane: University of Queensland.
Homeless at home? Analysing the housing needs and insecurities of single, older, non-homeowning women. UQ|UP Research Paper no. 2/2019. Brisbane: University of Queensland.
Petersen M, Parsell C, Phillips R, White G 2014. Preventing first time homelessness amongst older Australians. AHURI Final Report No. 322. Melbourne: Australian Housing and Urban Research Institute Limited.
Thredgold C, Beer A, Zufferey C, Peters A, Spinney A 2019. An effective homelessness services system for older Australians. AHURI Final Report No. 322. Melbourne: Australian Housing and Urban Research Institute Limited.