Social housing dwellings
Number of dwellings
In 2015–16, there were 432,800 social housing dwellings across Australia—a rise of approximately 5,000 dwellings from the previous 12 months (427,800), and an increase of around 5% from the 413,000 dwellings in 2009–10. Despite growth in the number of dwellings, this stock is failing to keep up with Australian household growth with social share dropping from 5.1% in 2007–08 to 4.7% in 2016 (AIHW analysis).
There has been a gradual but steady policy focus towards growing the community housing sector and transferring ownership or management of public rental housing stock to community housing organisations. This has provided community organisations an opportunity to expand their operational capacity and to demonstrate the ability to be flexible in their delivery of social housing.
Between 2009–10 and 2015–16, public rental housing stock reduced by approximately 4% (333,400 to 320,000 dwellings) (Figure SHD.1), and mainstream community housing increased by 81%, from 44,300 to 80,200 dwellings (Figure SHD.2).
Figure SHD.1: Number of social housing dwellings by program type, 2009–2016

Note: ‘Other social housing’ includes mainstream community housing, SOMIH, Indigenous community housing and NT remote community housing.
Source: AIHW National Housing Assistance Data Repository 2015–16, Social housing dwellings Table DWELLINGS.1.
SOMIH stock reduced between 2009–10 and 2015–16 by 17%—from 12,000 to 9,900 dwellings. Indigenous community housing dwelling numbers also decreased by 6% over the same period—from 18,700 to 17,600 dwellings (Figure SHD.2).
Figure SHD.2: Number of social housing dwellings by program type (excluding public rental housing), 2009–2016

SOMIH = state-owned and managed Indigenous housing
Source: AIHW National Housing Assistance Data Repository 2015–16, Social housing dwellings Table DWELLINGS.1.
Across Australia, the overall occupancy rate for social housing is very high. As at 30 June 2016, occupancy rates for public housing dwellings was 98%, ranging from 95% in the Northern Territory to 99% in New South Wales. Overall, SOMIH dwelling occupancy rates were 97%, and for mainstream community housing dwellings, 90% down from 94% in 2014–15. The overall occupancy rate for Indigenous community housing dwellings was 94%.
Location
As at 30 June 2016, New South Wales had the largest number of social housing dwellings across each program type, except for Indigenous community housing, which had more dwellings reported in Queensland. Victoria had the next highest number of dwellings for public housing and mainstream community housing (Table SHD.1).
| Social housing program | NSW | Vic | Qld | WA | SA | Tas | ACT | NT | Aust |
|---|---|---|---|---|---|---|---|---|---|
| Number of dwellings | |||||||||
| Public housing | 110,174 | 64,241 | 51,188 | 33,533 | 37,852 | 7,166 | 10,917 | 4,970 | 320,041 |
| SOMIH(a) | 4,613 | . . | 3,344 | . . | 1,769 | 223 | . . | . . | 9,949 |
| Mainstream community housing(b) | 32,266 | 14,236 | 11,679 | 7,409 | 7,472 | 6,076 | 715 | 372 | 80,225 |
| Indigenous community housing(b)(c)(d) | 4,845 | 1,939 | 5,154 | 2,670 | 974 | 76 | . . | 1,926 | 17,584 |
| All programs(e) | 151,898 | 80,416 | 71,365 | 43,612 | 48,067 | 13,541 | 11,632 | 7,268 | 427,799 |
| Dwellings (%) | |||||||||
| Public housing | 72.5 | 79.9 | 71.7 | 76.9 | 78.7 | 52.9 | 93.9 | 68.4 | 74.8 |
| SOMIH(a) | 3.0 | . . | 4.7 | . . | 3.7 | 1.6 | . . | . . | 2.3 |
| Mainstream community housing(b) | 21.2 | 17.7 | 16.4 | 17.0 | 15.5 | 44.9 | 6.1 | 5.1 | 18.8 |
| Indigenous community housing(b)(c)(d) | 3.2 | 2.4 | 7.2 | 6.1 | 2.0 | 0.6 | . . | 26.5 | 4.1 |
| All programs | 100.0 | 100.0 | 100.0 | 100.0 | 100.0 | 100.0 | 100.0 | 100.0 | 100.0 |
SOMIH = state-owned and managed Indigenous housing
- VIC, WA, ACT and NT do not have SOMIH programs.
- Community housing data are incomplete due to non-reporting or under-reporting by community housing providers. Data may not be comparable across jurisdictions due to differences in the accuracy of the data (e.g., reflecting differences in how the data for the collection was sourced by jurisdictions, the number and profiles of providers for which data were provided/not provided, the completeness of the data reported for some providers and the instances of unknown values recorded for some data items). Note, the total number of tenancy (rental) units is counted for mainstream community housing instead of actual dwellings because some dwellings such as group houses have multiple rental spaces within the one dwelling.
- Indigenous community housing data includes permanent dwellings managed by funded and unfunded providers.
- ACT does not have an Indigenous community housing program.
- The figures for Australia and NT do not include remote public housing dwellings in the Northern Territory (5,046). Remote public housing dwelling counts are provided separately, as they are not currently captured by the Indigenous community housing or Public housing data collections.
Source: AIHW National Housing Assistance Data Repository, 2015–16.
Proportions of social housing dwellings varied across remoteness areas. The highest proportions of public rental housing and mainstream community housing were found in Major cities, SOMIH in Outer regional areas, and Indigenous community housing in Remote and Very remote areas (Figure SHD.3).
As at 30 June 2016, almost 3 in 4 public rental housing dwellings (74%) were located in Major cities and a further 15% in Inner regional areas. Less than 1% of public rental housing was located in Very remote areas. Over one-third of SOMIH dwellings were located in Major cities (36%), 25% in Outer regional locations and 24% in Inner regional areas.
Mainstream community housing followed a similar trend to public housing, with almost two-thirds (66%) of dwellings located in Major cities, with an additional 24% located in Inner regional areas. Less than 2% of mainstream community housing dwellings were located in Remote or Very Remote areas.
As expected, a large proportion (64%) of Indigenous community housing was located in Remote or Very Remote areas.
Figure SHD.3: Proportion of social housing dwellings by remoteness area and housing program type, at 30 June 2016

SOMIH = state-owned and managed Indigenous housing
Source: AIHW National Housing Assistance Data Repository 2015–16, Social housing dwellings Table DWELLINGS.4.
Dwelling type
As at 30 June 2016, public rental housing dwellings were more likely to be in the form of a separate house (39%), followed by a flat, unit or apartment (34%).
The vast majority of SOMIH dwellings were in the form of a separate house (81%), with a further 15% being a semi-detached house or townhouse.
Mainstream community housing dwellings were more likely to be a flat, unit or apartment (46%), followed by a separate house (33%) (Figure SHD.4).
Figure SHD.4: Proportion of social housing dwellings by structure and social housing program, at 30 June 2016

SOMIH = state-owned and managed Indigenous housing
Source: AIHW National Housing Assistance Data Repository 2015–16, Social housing dwellings Table DWELLINGS.5.
Dwelling size
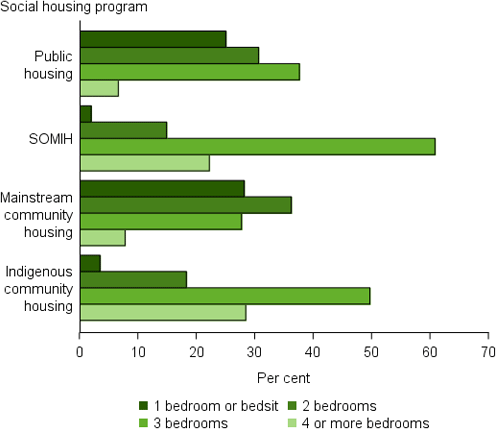
The size of social housing dwellings in 2016 differed across program type. Public rental housing dwellings were most likely to be three bedroom dwellings (38%), followed by two bedroom dwellings (31%). SOMIH dwellings were also most likely to be three bedroom dwellings (61%), followed by four bedroom dwellings (19%).
In contrast, mainstream community housing dwellings were more likely to be two bedroom dwellings (36%), followed by one or three bedroom dwellings (both 28%).
Half of Indigenous community housing dwellings were three bedroom (50%) with a further 24% four bedroom dwellings (Figure SHD.5).
Figure SHD.5: Proportion of social housing dwellings by household size and housing program type, at 30 June 2016
SOMIH = state-owned and managed Indigenous housing
Source: AIHW National Housing Assistance Data Repository 2015–16, Social housing dwellings Table DWELLINGS.6.