Social housing dwellings

Quick facts

  • At 30 June 2019, there were around 437,700 social housing dwellings, similar to the previous 12 months and a 7% increase since 2006.
  • The majority of social housing dwellings were public housing stock at 30 June 2019 (70% or 305,200 dwellings); decreasing from 341,400 (84%) in 2006.
  • The number of community housing dwellings more than tripled (from 32,300 in 2006, to 100,200 dwellings in 2019; a 210% increase or 67,900 dwellings), partly due to the transfer of ownership or management of public housing dwellings to community housing organisations.
  • The vast majority of social housing dwellings were tenantable and occupied.
  • The greatest proportion of social housing dwellings were separate houses and 3-bedroom dwellings.

There is considerable diversity in the number and characteristics of dwellings offered by the main four social housing programs in Australia (public housing, state owned and managed Indigenous housing (SOMIH), community housing and Indigenous community housing). Over time, the number of available dwellings can change due to sales and purchases of stock and redevelopment or refurbishment, to ensure stock is safe and suitable for occupants. Having dwellings of suitable condition, quality and size is important for the health and wellbeing of the occupants.

What is a dwelling?

For the purpose of this report, a dwelling is defined as a structure, or a discrete space within a structure, intended for a person or group of people to live. Dwelling types include:

  • a separate house
  • a semi-detached, row or terrace house, townhouse, etc.
  • a flat, unit or apartment; caravan, tent, cabin etc.

The concept of a dwelling may be different across the social housing collections; see the Data quality statements page for more information.

Social housing dwellings

At 30 June 2019, there were around 437,700 dwellings in Australia’s four social housing programs. Of these social housing dwellings:

  • 70% or 305,200 dwellings were public housing
  • 23% or 100,200 dwellings were community housing
  • 3% or 14,700 dwellings were state owned and managed Indigenous housing (SOMIH)
  • 4% or 17,700 dwellings were Indigenous community housing (Supplementary table DWELLINGS.1).

Changes over time

Between 30 June 2006 and 2019, Australia’s social housing stock increased by 28,900 dwellings; a 7% increase. This includes a more recent increase of 1,500 dwellings across the four programs between 2018 and 2019.

There has been considerable change in the social housing stock across the four programs, particularly with the transferring ownership and/or management of public housing stock to community housing organisations. In Australia, there was an 11% decrease in the number of public housing dwellings from 341,400 to 305,200 between 2006 and 2019. The reduction in public housing stock has been partly offset by the number of dwellings in community housing; this increased from 32,300 in 2006, to 100,200 dwellings in 2019) (Figure DWELLINGS.1).

Figure DWELLINGS.1: Dwellings, by social housing program, at 30 June 2006 to 2019. This vertical stacked bar graph shows from 2006 to 2019 the most social housing dwellings were consistently in public housing. The number of public housing dwellings decreased from 341,400 (or 84%) in 2006 to 305,200 (or 70%) in 2019. This compares with the number of community housing where the number of dwellings increased from 32,300 (or 8%) in 2006 to 100,200 (or 23%) in 2019. The number of SOMIH dwellings decreased from 12,900 (3.2%) in 2006 to 14,700 (3.3%) in 2019.

There have also been changes in the management of dwellings between the Indigenous community housing, public housing and SOMIH programs. Between 2008 and 2010, around 5,000 dwellings were transferred from Indigenous community housing to NT remote public housing (Supplementary table DWELLINGS.1). In 2017, these NT remote public housing dwellings were transferred into the SOMIH program. These changes have driven most of the fluctuations in the numbers of SOMIH and Indigenous community housing dwellings over this time. More recently, the number of SOMIH dwellings has been stable just under 15,000 dwellings since 2017. For Indigenous community housing, the number of dwellings decreased from 17,900 in 2017 to 17,700 in 2019 (Figure DWELLINGS.1).

Location of dwellings

At 30 June 2019, New South Wales had the largest number of public and community housing dwellings (100,600 and 46,600 dwellings respectively) (Supplementary table DWELLINGS.2). For Indigenous community housing, Queensland (5,400) had the most dwellings. These results were similar to previous years. For SOMIH, the Northern Territory (5,200 dwellings) had the most dwellings which was similar to the previous year.

At 30 June 2019, there was considerable diversity in the social housing profiles of the states and territories. For Victoria, Queensland, Western Australia and South Australia, the majority of dwellings were public housing (70–80%) followed by community housing (15–25%). In contrast, Tasmania and New South Wales had a greater proportion of community housing dwellings (48% and 30% respectively). In the Northern Territory, 41% of dwellings were SOMIH dwellings and 16% were Indigenous community housing (Figure DWELLINGS.2). Note that not all states/territories have all housing programs.

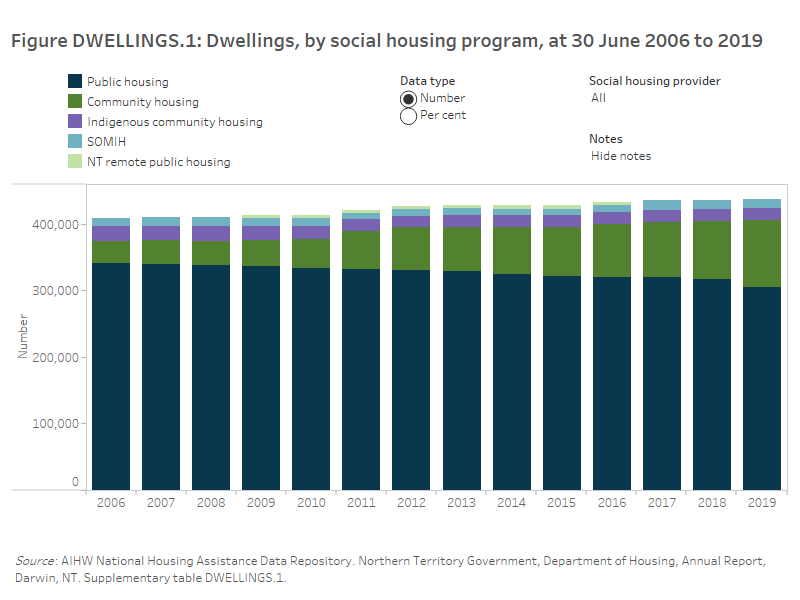
Figure DWELLINGS.2: Dwellings, by social housing program, and states and territories, at 30 June 2014 to 2019. This vertical stacked bar graph shows the variation in the number and percent of dwellings in each social housing program (public housing, SOMIH, community housing and Indigenous community housing) across the states and territories and nationally. In 2019, the Australian Capital Territory (92%) had the highest proportion of public housing dwellings compared with the Northern Territory (40%) which had the lowest. In contrast, Tasmania had the highest proportion of community housing dwellings (48%) compared with the Northern Territory which had the lowest (3.4%), in 2019. Queensland had the highest number of Indigenous community housing dwellings increasing from 5,000 in 2014 to 5,400 dwellings in 2019.

The location of social housing overall reflects the geographic population distribution of Australia, with large concentrations seen in urban centres in the south-east and east coastal areas. Considering the four different social housing programs, the location of dwellings managed by each program reflects their differing target groups.

At 30 June 2019, the highest proportion of public and community housing dwellings were in Major cities (75% and 64%, respectively) (Supplementary table DWELLINGS.3). The highest proportion of SOMIH and Indigenous community housing dwellings were in Very remote areas (30% and 39%, respectively) (Figure DWELLINGS.3).

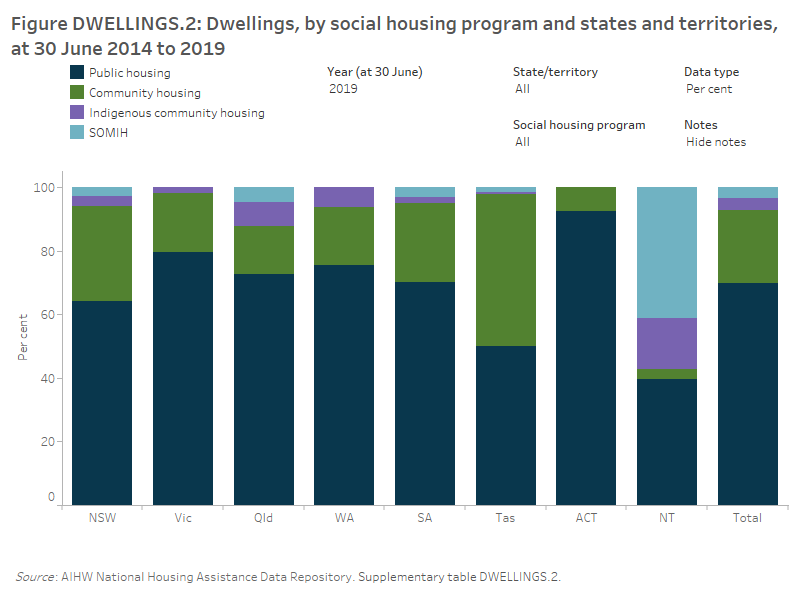
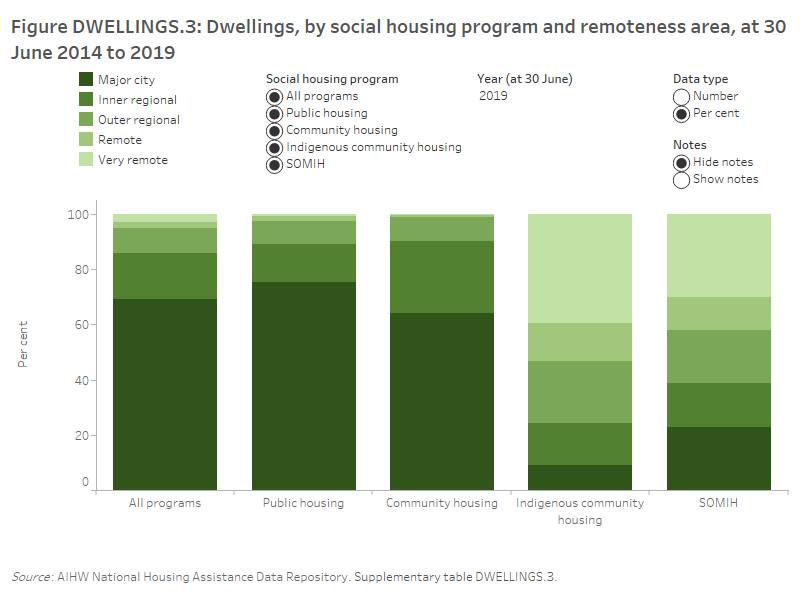
Figure DWELLINGS.3: Dwellings, by social housing program and remoteness area, at 30 June 2014 to 2019. This vertical stacking bar graph shows that across the social housing programs, the highest number and proportion of dwellings were in Major cities. Between 2014 to 2019, combining all social housing programs, most dwellings were in Major cities (69–70%) compared with 2.2% to 3.3% in Very remote areas. In 2019, Indigenous community housing had the highest proportion of dwellings in Very remote areas (39%) followed by SOMIH (30%). Community housing (0.4%) and public housing (0.9%) had the lowest proportions in Very remote areas.

The location of social housing is an important component of suitability. Location is often associated with employment opportunities, health services, transportation services etc. (AIHW 2019). For further information on the suitability of social housing in terms of location, see the latest National Social Housing Survey 2018: Key results.

Occupancy

Occupancy describes whether a dwelling is occupied under a formal tenancy. In social housing, occupancy rates are influenced by tenancy turnover, housing supply and demand as well as the need for the redevelopment or replacement of dwellings. At times, major maintenance work needs to be completed before dwellings can be allocated to a new household.

At 30 June 2019, public housing and SOMIH both had 97% occupancy rates, higher than community housing (96%) and Indigenous community housing (94%) (Supplementary table DWELLINGS.4).

There was some diversity in the occupancy rates for public housing when considering remoteness areas. At 30 June 2019, occupancy rates were higher for public housing dwellings in Major cities (97%) and Inner regional areas (98%) and lowest in Remote (93%) and Very remote areas (91%) (Supplementary table DWELLINGS.5).

Tenantable status

The tenantable status of a dwelling relates to whether it provides a certain level of basic amenity and that maintenance is completed to the required minimum level. At 30 June 2019, almost all public housing dwellings were tenantable (98%); higher than the proportion of SOMIH (97%) and community housing dwellings (92%) (Supplementary table DWELLINGS.6).

At 30 June 2019, 4,400 (or 1%) public housing dwellings were not tenantable and 2,400 (or 1%) were undergoing major development. For SOMIH, over 400 dwellings were not tenantable and around 60 were undergoing major development.

Dwelling characteristics

At 30 June 2019, there was a relatively even spread of public housing dwellings that were a separate house (38%), flat, unit or apartment (35%) or semi-detached, townhouse, etc. (27%) (Supplementary table DWELLINGS.7). By contrast, the vast majority of SOMIH dwellings were a separate house (83%), with a further 14% a semi-detached, townhouse etc., which may partially reflect the location of these dwellings.

There has been a small change in the dwelling types offered in public housing since 2012, with separate houses decreasing from 39% to 38% of all dwellings by 2019 and flat, unit or apartments increasing from 33% to 35% over the same period.

Community housing dwellings were more likely to be a flat, unit or apartment (49%), followed by a separate house (30%) in 2019. There has been an increase in the proportion of flat, unit or apartment type dwellings in community housing since 2012, increasing from 43% to 49% of dwellings in 2019 (Figure DWELLINGS.4).

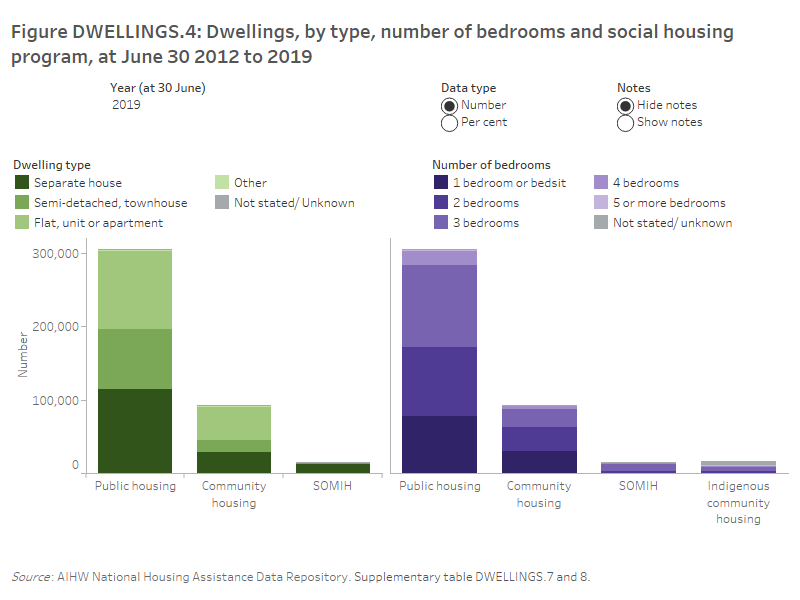
DWELLINGS.4: Dwellings, by type, number of bedrooms and social housing program, at 30 June 2012 to 2019. This figure consists of two sections. The first vertical graph shows the number and percent of dwellings by type and social housing program. The second vertical graph shows the number and percent of dwellings by number of bedrooms and social housing program. In 2019, the most common dwelling type in public housing was separate houses (115,200 or 38%) compared with community housing dwellings which were more likely to be a flat, unit or apartment (46,000 or 49%). The size of social housing dwellings differed across program types. Public housing (37%), SOMIH (59%) and Indigenous community housing (33%) were most likely to be 3 bedroom dwellings; compared with community housing dwellings, which were most commonly 2 bedroom dwellings (35%), in 2019.

The size of social housing dwellings differed across program types. At 30 June 2019:

  • public housing dwellings were most likely to be 3 bedroom dwellings (37% or 111,600 dwellings), followed by 2 bedroom dwellings (31% or 94,200).
  • the majority of SOMIH dwellings were 3 bedroom dwellings (59% or 8,700 dwellings), with very few 1 bedroom dwellings (2%).
  • community housing dwellings were most commonly 2 (35% or 33,000) or 1 bedroom (32% or 29,900) dwellings.
  • just under half of Indigenous community housing dwellings were 3 bedroom dwellings (47% or 5,300) and a further 26% (or 2,900) were 4 bedroom dwellings. Similar to SOMIH, very few were 1 bedroom dwellings (3%) (Supplementary table DWELLINGS.8).

Over time, the proportion of public housing dwellings that have 3 bedrooms has declined from 39% in 2012 to 37% in 2019. This is also the case for SOMIH dwellings (down from 62% in 2012 to 59% in 2019) (Figure DWELLINGS.4).

Dwellings managed by providers

Community housing and Indigenous community housing dwellings are managed by non-government providers. There is some diversity in terms of how many dwellings these two providers manage.

Community housing providers

At 30 June 2019, there were over 500 community housing providers across Australia with the majority managing less than 50 dwellings (Supplementary table DWELLINGS.9). New South Wales (153 organisations) had the most community housing providers, and the majority of these providers managed less than 20 dwellings. Queensland (112 organisations) had a similarly high number of community housing providers; again, most managed less than 20 dwellings. New South Wales also had the highest number of community housing providers that managed 200 or more dwellings (27 organisations).

Indigenous community housing providers

At 30 June 2019, most (168 organisations) Indigenous community housing providers were managing less than 50 dwellings (Supplementary table DWELLINGS.9). New South Wales had the highest number of Indigenous community housing providers (over 100 organisations), with over half managing fewer than 20 dwellings.

Glossary