Financial assistance

Quick facts

  • Australian Government Commonwealth Rent Assistance (CRA) key findings include:
    • At June 2020, around 1.7 million income units (individuals or group of related persons) were receiving Commonwealth Rent Assistance (CRA).
    • From June 2019 to 2020, the number of income units receiving CRA increased from 1.29 million to 1.7 million.
    • 2 in 5 (29% or 487,900 income units) were considered to be in rental stress after receiving CRA.
    • In 2020, 31% of those receiving CRA and JobSeeker Payment (Newstart Allowance) were in rental stress; a decrease from 60% in 2019.
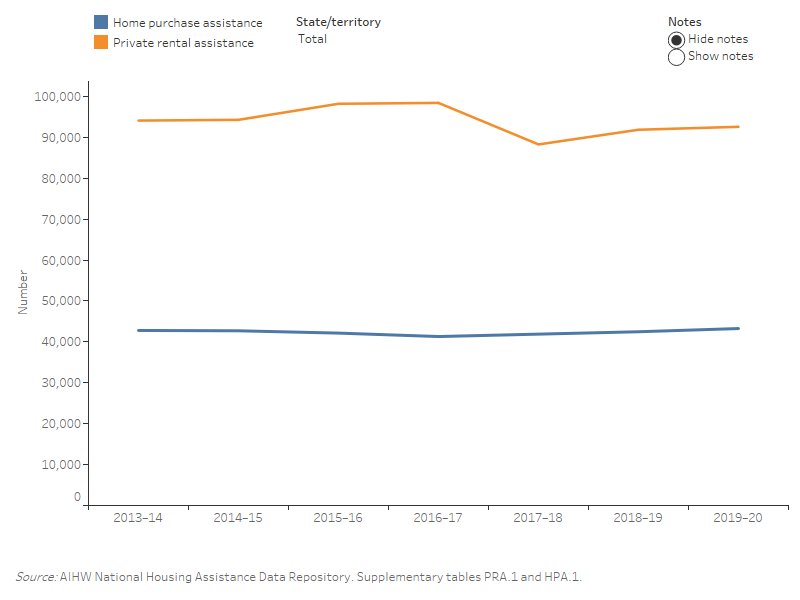
  • State/territory government provided programs in 2019–20:
    • Around 92,600 households received Private Rent Assistance (PRA).
    • Home Purchase Assistance (HPA) was received by 43,300 households.
    • PRA was more likely to be provided to recipients in major cities compared with HPA (63% and 58% respectively).

Financial assistance is a sizeable part of the broader provision of housing assistance in Australia. Governments provide various forms of financial support to assist people on lower incomes to meet housing costs, whether it is rental costs, mortgage repayments, saving a deposit for a home purchase or accessing finance. Housing costs are often a major expense for lower income earners and, therefore, financial assistance can be seen as an important safety net.

This section primarily focuses on the following three types of financial assistance:

  • assistance with rental costs through the:
    • Commonwealth Rent Assistance program
    • Private Rent Assistance programs
  • assistance with buying a home through Home Purchase Assistance programs.

Commonwealth Rent Assistance (CRA)

CRA is the most common form of housing assistance received by Australian households. It is an Australian Government payment to families and individuals who pay or are liable to pay private rent or community housing rent, over specified thresholds and are in receipt of:

  • a social security or veterans’ income support payment; and/or
  • receive Family Tax Benefit Part A at greater than the base rate.

Commonwealth Rent Assistance

CRA is a non-taxable payment, generally paid fortnightly to eligible recipients as part of a recipient’s primary payment rate. To be eligible, families or individuals paying private rent must: be in receipt of a social security or veterans’ income support payment and/or more than the base rate of Family Tax Benefit Part A, and pay or be liable to pay more than the specified rent thresholds.

CRA eligibility is based on eligibility for the primary payment and it forms part of the rate of payment. For information about CRA eligibility, see Department of Social Services.

CRA is paid at 75 cents for every dollar above a minimum rental threshold until a maximum rate (or ceiling) is reached. The minimum threshold and maximum rates vary according to the household or family situation, including the number of children.

Certain social housing tenants are eligible for CRA, such as those living in community housing or Indigenous community housing and, in some states and territories, state owned and managed Indigenous housing (SOMIH). CRA is not generally payable to public housing tenants as state and territory housing authorities already subsidise rent for these tenants.

Payment of CRA continues as long as recipients meet qualification and payability criteria for their primary payments, as well as CRA eligibility conditions.

Source: DSS 2019.

At 26 June 2020, around 1.7 million income units received CRA; around 414,200 more income units than at the same time in 2019 and around 354,200 more than the former peak of 1.35 million in 2016 (Supplementary table CRA.2). The median CRA payment was $132 per fortnight, which was equivalent to 29% of median fortnightly rent ($460 per fortnight) (Supplementary table CRA.1). For more information, see Impact of Covid-19 on the receipt of government benefits.

In 2019–20, the Australian Government’s real expenditure on CRA was $4.7 billion, increasing from $4.5 billion in 2018–19 (SCRGSP 2021). At 26 June 2020, most CRA payments were provided to income units in New South Wales (538,800 income units) followed by Queensland (436,300) (Supplementary table CRA.2).

Selected CRA recipient characteristics

At 26 June 2020, the key characteristics of the income units receiving CRA were (Supplementary table CRA.2):

  • 2 in 5 (41%) were single with no dependent children
  • 1 in 5 were those aged 30–39 years (22%)
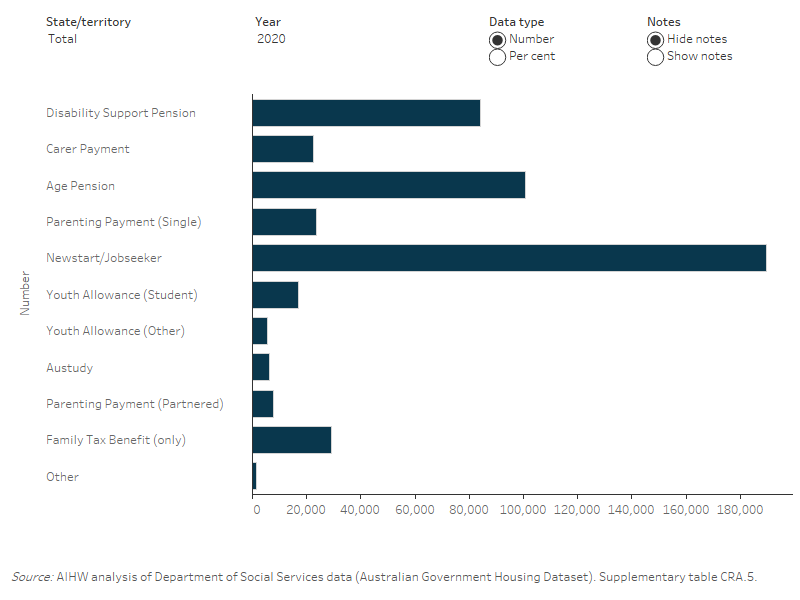
  • around 2 in 5 (38%) received JobSeeker Payment followed by Age Pension (18%) as their primary payment type.

Changes over time

From 28 June 2019 to 26 June 2020, the notable changes to the characteristics of income units receiving CRA changed included (Supplementary table CRA.2):

  • An increase in those also receiving JobSeeker Payment increased from 262,000 (or 20% of all CRA recipients) in 2019 to 644,300 (38%) in 2020; by contrast, there was decrease in the number receiving Family Tax Benefit (only) from 178,600 (14%) to 143,800 (9%).
  • The number of Single, no children, sharer income units increased from 163,300 in 2019 to 321,900 in 2020.

For more information, see Impact of Covid-19 on the receipt of government benefits.

State and territory and selected characteristics

The profile of income units receiving CRA varied by state and territory. At 26 June 2020 (Supplementary table CRA.2):

  • 2 in 5 (46%) income units in Tasmania were Single, no dependent children compared with 39% with this living arrangement in Queensland.
  • Just under half (48%) of income units in the Northern Territory also received JobSeeker Payment compared with 32% in Tasmania.
  • Around one in seven (15%) of income units in the Australian Capital Territory received Youth Allowance (Student); by contrast, 1.4% of income units receive this payment in the Northern Territory.

CRA entitlement

The CRA payment received as a proportion of median fortnightly rent varied by location. In Sydney, an income unit’s CRA entitlement was 24% of rent (median fortnightly rent of $550), while in the rest of New South Wales, the CRA entitlement was a greater proportion of rental costs, at 34% (median fortnightly rent of $410), at 26 June 2020 (Supplementary table CRA.1).

For Queensland, the difference between CRA entitlements as a proportion of rent was smaller when comparing the capital city and rest of state. CRA entitlement was 27% of rent in Brisbane and 29% in the rest of the state. In Tasmania CRA entitlement was 32% in Hobart and 35% in the rest of state (Supplementary table CRA.1).

Impact of COVID-19 on the receipt of government benefits

COVID-19, JobSeeker Payment and Youth Allowance

The jobless rate in Australia increased as the COVID-19 pandemic severely affected the Australian economy (Parliamentary Library 2020). In December 2019, the seasonally adjusted unemployment rate was 5.1%, which grew to 7.5% by July 2020. By December 2020, the unemployment rate had fallen to 6.6% (ABS 2021).

In response to COVID-19 and the resulting increase in the unemployment rate, Australian Government made temporary changes to social security payments. These adjustments have increased the number of people eligible for and receiving income support payments (Parliamentary Library 2020).

Following COVID-19 in the beginning of 2020, the government introduced the Coronavirus Supplement which was payable to recipients of the following income support payments: JobSeeker Payment (formerly Newstart Allowance), Youth Allowance (JobSeeker, Student and Apprentice), Parenting Payment (Partnered and Single), Sickness Allowance, Austudy payment, ABSTUDY living allowance, Widow Allowance, Partner Allowance, Farm Household Allowance, Special Benefit, and certain Department of Veterans Affairs student payments. The information below reports on how COVID-19 affected JobSeeker Payment and Youth Allowance only.

The main income support payments available for those aged 16–65 who are able to work but unable to support themselves are JobSeeker Payment and Youth Allowance (Other). Sickness Allowance and Bereavement Allowance were incorporated into JobSeeker Payment, when it was introduced on 20 March 2020 (Parliamentary Library 2020). The timing of this change coincided with the outbreak of the pandemic in Australia and the rising unemployment. For single person with no children household, the maximum payment rate for JobSeeker Payment is $570.80 per fortnight. For a partnered person household, this is $515.40 per fortnight (Services Australia 2021c).

In response to the pandemic, the Australian Government introduced additional payments to support lower income Australians, including the Coronavirus Supplement and Economic Support Payments, available to eligible income support recipients. Over time, the amount paid to recipients changed (Parliamentary Library 2021a):

  • from 27 April 2020 to 24 September 2020, recipients received $550 per fortnight
  • from 25 September 2020 to 31 December 2020, recipients received $250 per fortnight
  • from 1 January 2021 to 31 March 2021, recipients received $150 per fortnight.

From 1 April 2021 onwards, JobSeeker Payment and Youth Allowance increased by $50 per fortnight (Services Australia 2021b).

Rental stress and CRA

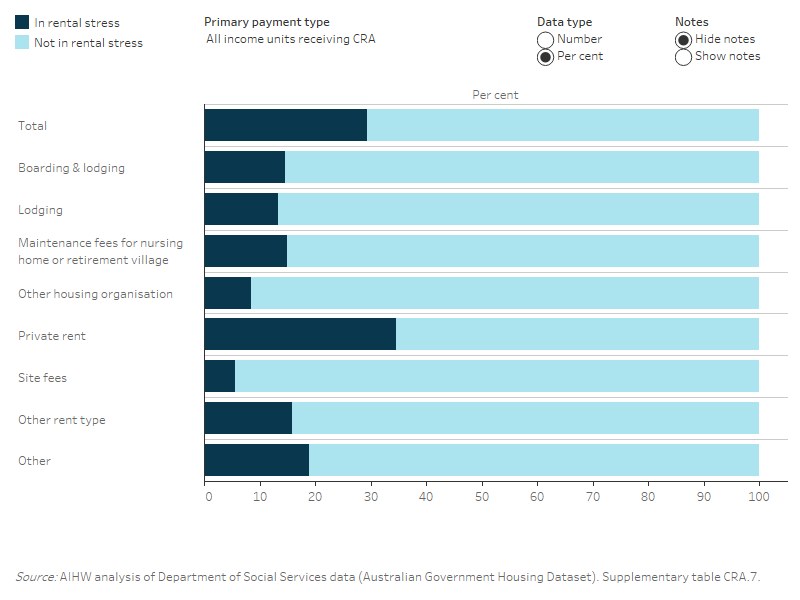
CRA has a considerable impact on reducing rental stress. Rental stress can be defined as spending more than 30% of gross household income on rent (SCRGSP 2021). At 26 June 2020, 55% of CRA recipients would have been in rental stress without CRA. With CRA this proportion was lower with 29% of CRA recipients in rental stress (Supplementary table CRA.3). 

In 2020, the time-limited Coronavirus Supplement was included as income for certain types of income support payments and has been included in the calculation of rental stress. 

Rental Stress, CRA and primary payment type

Rental stress for income units receiving CRA differed depending upon the primary payment type. Comparing 28 June 2019 with 26 June 2020, for income units in receipt of CRA (Supplementary table CRA.5) the proportion in rental stress after receiving CRA:

  • there was a decrease from 60% to 31% for those receiving JobSeeker Payment/ Newstart Allowance
  • there was a decrease from 73% to 21% among those receiving Youth Allowance (Other).

Special Needs Groups

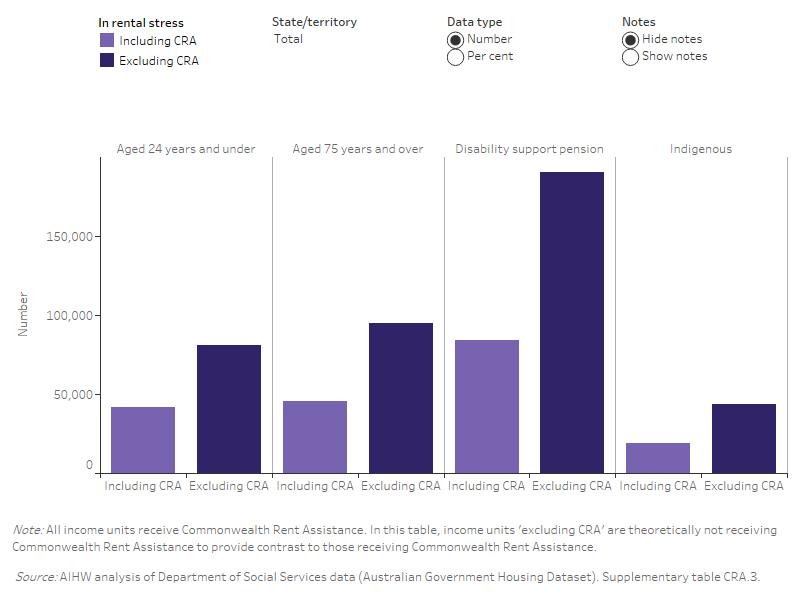
The impact of CRA on reducing rental stress varies between income unit types. At 26 June 2020, those on Disability Support Pension (32% in rental stress) were the most likely of the special needs groups to be in rental stress after CRA. (Figure FINANCIAL.1) (Supplementary table CRA.3). For income units aged 24 years and under in receipt of CRA 24% were in rental stress in 2020; by contrast, for income units aged 75 years and over the proportion in rental stress was higher at 29%. For those income units including at least one Indigenous member, around 1 in 5 (19%) were in rental stress with CRA (Figure FINANCIAL.1) (Supplementary table CRA.3).

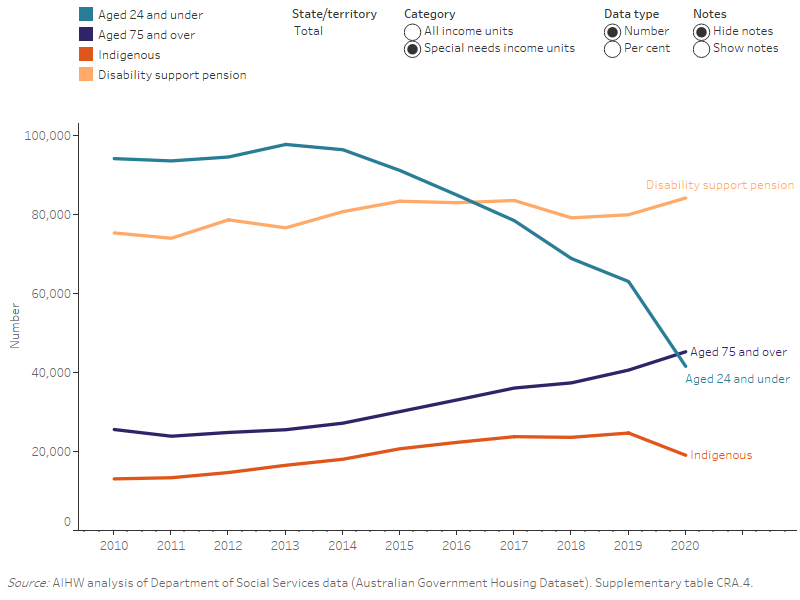
Of the income units, receiving CRA by special needs group, at 26 June 2020 (Figure FINANCIAL.1) (Supplementary table CRA.4):

  • The Australian Capital Territory had the highest proportion of CRA income units aged 24 and under in rental stress (39%) followed by New South Wales (31%).
  • Western Australia and the Northern Territory (34% both) had the largest proportion of income units receiving Disability Support Pension who were in rental stress; the lowest proportion were those in Tasmania (24%).

Figure FINANCIAL.1: Income units receiving Commonwealth Rent Assistance in rental stress, by special needs group and states and territories, 2020

Figure FINANCIAL.1: Income units receiving Commonwealth Rent Assistance (CRA) in rental stress, paying more than 30 per cent of income on rent, by special needs group and states and territories, at 28 June 2020. This vertical bar graphs compares special needs groups income units in rental stress with CRA and without CRA. Nationally, 72% of income units receiving Disability Support Pension without CRA were in rental stress compared with 46% of income units aged 24 years and under in rental stress without CRA. Indigenous income units (19%), followed by income units aged 24 years and under (24%) were the least likely of the special needs groups to be in rental stress (i.e. paying more than 30% of their income on rent) after CRA. Across the states and territories, the highest proportion of income units in rental stress after CRA varied. In NSW, VIC, WA, SA and NT, incomes units with disability support pension were most likely special needs group to be in rental stress after CRA. In Qld and ACT, incomes united aged 75 and over were the most likely to be in rental stress after CRA.

Changes over time

The change in the proportion of income units by special needs group in rental stress over time varied depending upon the special needs group. From 28 June 2019 to 26 June 2020 (Figure FINANCIAL.2) (Supplementary table CRA.4):

  • The largest decrease in the proportion of income units in rental stress of the special needs group were those aged 24 and under, declining from 58% to 24%.
  • By contrast, those aged 75 and over was relatively stable (28% to 29%).

Of all income units that received the Coronavirus Supplement in 2020, the younger age groups are the most likely to have receive the income support payments (in particular those that received JobSeeker Payment and Youth Allowance).

Figure FINANCIAL.2: Income units receiving Commonwealth Rent Assistance in rental stress, by special needs group and states and territories, 2010 to 2020

Figure FINANCIAL.2: Income units receiving Commonwealth Rent Assistance (CRA), in rental stress, by special needs group, 2010 to 2020. This line graph shows that rental stress (i.e. paying more than 30% of their income on rent) was highest for income units receiving Disability Support Pension, with 32% of income units in rental stress after CRA. Income units aged 24 and under were consistently the highest between at June 2010 and 2019, with around 57% to 58% of income units in rental stress after CRA. This changed at June 2020, with 24% of income units aged 24 and under in rental stress after CRA; around half the proportion of 2019. Similarly, income units including at least one Indigenous member in rental stress declined from 33% at June 2019 to 19% at June in 2020. The proportion of people aged 75 years and over in rental stress increased from 24% at June 2013 to 29% in 2020. At June 2020, around 33% of income units including at least one Indigenous member received CRA.

Primary payment type and Rental stress

The incidence of rental stress between income units varied depending upon primary payment type and the receipt of CRA. At 26 June 2020 (Figure FINANCIAL.3) (Supplementary table CRA.5):

  • the highest proportion of those in rental stress received Parenting Payment (Partnered) (36%)
  • around 1 in 3 (31%) of those receiving JobSeeker Payment as their primary payment type were in rental stress
  • just over 1 in 3 (34%) of those receiving Age Pension and 32% of those receiving Disability Support Pension were in rental stress.

The data for 2020 were affected by the Coronavirus Supplement. 

State and territory and rental stress

The proportion of income units receiving CRA who were in rental stress varied depending upon the state or territory and primary payment type. At 26 June 2020 (Figure FINANCIAL.3) (Supplementary table CRA.5):

  • New South Wales (39%) and the Australian Capital Territory (37%) had the highest proportion of income units receiving JobSeeker Payment in rental stress.
  • The Australian Capital Territory also had the highest proportion of income units in receipt of Youth Allowance (Student) (46%), Age Pension (41%) and Parenting Payment (Single) (33%) in rental stress.

The data for 2020 were affected by the Coronavirus Supplement. Additional information about income units receiving government payments can also be found in the Impact of COVID-19 on the receipt of government benefits section above.

Figure FINANCIAL.3: Income units receiving Commonwealth Rent Assistance in rental stress, by primary payment type and states and territories, 2013 to 2020

Figure FINANCIAL.3: Income units receiving Commonwealth Rent Assistance in rental stress, by primary payment type and states and territories, 2013 to 2020. The horizontal bar graph compares income units receiving CRA in rental stress by primary payment types and states and territory. The graph shows that of income units in rental stress receiving CRA in 2020, the highest proportion received Parenting Payment (Partnered), with 36%, followed by Age Pension, with 34% and Disability Support Pension, with 32%. In 2020, there were steep declines in the proportion of income units in rental stress after CRA across payment types. For all states and territories, income units with JobSeeker payments in rental stress after receiving CRA, were the highest number.

.

Rent type and rental stress

The experience of rental stress among income units receiving CRA was also different across primary payment and rent types. After receiving CRA (Figure FINANCIAL.4) (Supplementary table CRA.7), at 26 June 2020:

  • Over one third (35% or 444,600) of those income units paying private rent were in rental stress; the majority of these (181,900) were receiving JobSeeker Payment.
  • Around 15% (14,600) of income units who were boarding and lodging were in rental stress; the majority (9,100) were receiving Disability Support Pension.

Figure FINANCIAL.4: Income units receiving Commonwealth Rent Assistance, by rent type and rental stress status, 2020

Figure FINANCIAL.4: Income units receiving Commonwealth Rent Assistance (CRA), by primary payment type, rent type and rental stress, 2020. This horizontal stacked bar graph shows for all income units receiving CRA, a higher proportion of income unit were not in rental stress (i.e. paying not more than 30% of income on rent) (71%) than those in rental stress (i.e. paying more than 30% of their income on rent) (29%). Income units who were paying private rent (35%) had the highest proportion in rental stress, followed by recipients with the rent type other (19%). In contrast, 5.6% of recipients paying for site fees were in rental stress after receiving CRA and 16% of recipients living in other housing organisations (including community housing).

Private Rent Assistance (PRA)

Private rent assistance is financial assistance provided directly by state and territory governments to low-income households experiencing difficulty in securing or maintaining private rental accommodation. PRA is usually provided as a one-off form of support such as bond loans and rental grants but can also include ongoing rental subsidies and payment of relocation expenses. PRA is provided to a ‘household’, which is a group of two or more related or unrelated people who usually reside in the same dwelling. A household can also be a single person living in a dwelling who makes provision for his or her own food and other essentials for living, without combining with any other person.

PRA varies between states and territories and some products are not offered by all states and territories (e.g. rental grants are offered by New South Wales, Queensland, South Australia and Tasmania; relocation expenses are offered by Tasmania and the Australian Capital Territory). For more information, see the Data quality statement for PRA.

In 2019–20, nationally PRA was provided to 92,600 unique households; an increase in the number of unique households than in 2017–18 (88,300 households) (Figure FINANCIAL.7) (Supplementary table PRA.1). Households may receive more than one type of PRA and they may also receive multiple assistance payments for each type of PRA. There were around 117,900 total instances of PRA payments (Supplementary table PRA.5), with just over 116,900 households receiving the various types of PRA (Figure FINANCIAL.5) (Supplementary table PRA.2).

Changes over time

The number of instances of assistance for PRA increased from 122,600 in 2013–14 to 128,400 in 2016–17 falling to 117,900 in 2019–20. The number of households receiving PRA decreased from 94,100 in 2013–14 to 92,600 in 2019–20. From 2013–14 to 2019–20, the number of households receiving bond loans decreased from 81,200 to 73,900, while households receiving one-off rental grants increased from 34,800 to 35,100 (Figure FINANCIAL.5) (Supplementary table PRA.5).

Key characteristics of households

Of the 92,600 unique households provided with PRA in 2019–20 (Supplementary table PRA.4):

  • the majority (72%) were households with the main applicant under 45 years of age
  • the largest 10 year age group were aged 25–34 (31%, or 28,300)
  • 16% (15,000) were households with at least one Indigenous member
  • other government pension/allowances was the main source of income for 23% of households, with a further 21% receiving JobSeeker Payment
  • over half (54% or 49,600) had a gross weekly household income of less than $700 per week

State and territory

The different states and territories provide different types of PRA. In 2019–20 (Supplementary table PRA.2):

  • Queensland (23,200 or 31%) and South Australia (14,700 or 20%) provided the greatest number of bond loans.
  • South Australia provided nearly half of the 35,100 one-off rental grants (14,800 or 42%).
  • New South Wales provided ongoing rental subsidies to around 7,600 households. No other state or territory provided these subsidies.

Figure FINANCIAL.5: Households receiving Private Rent Assistance and Home Purchase Assistance, by states and territories, 2013–14 to 2019–20

Figure FINANCIAL.5: Households receiving Private Rent Assistance and Home Purchase Assistance, by states and territories, 2013–14 to 2019–20. This line graph compares the number of households receiving Private Rent Assistance with households receiving Home Purchase Assistance from 2013–14 to 2019–20 by states and territories. Nationally, in 2019–20, the number of households receiving PRA has declined, with 92,600 households compared with 94,100 household in 2013–14. For HPA, nationally, the number of households receiving HPA has increased, with 43,300 households receiving HPA in 2019–20 compared with 42,800 in 2013–14. States and territories varied in the number of households receiving PRA and HPA. QLD (32,800), NSW (21,500) and ACT (731) recorded their highest number of households receiving PRA in 2019–20. For NT, WA and SA, more households received HPA than PRA in 2019–20.

Remoteness

In 2019–20, 3 in 5 (63%) PRA payments were to households located in Major cities, with a further 22% in Inner regional areas and 13% in Outer regional areas. Very few households receiving PRA were located in Remote or Very remote areas (around 1% in both) (Supplementary table PRA.3).

The majority (78%) of households receiving Relocation expenses were in Major cities; a further 8% were in Inner regional areas. Around 14% of households receiving Bond loans were in Outer regional areas.

Home Purchase Assistance (HPA)

Home Purchase Assistance (HPA) is a form of government financial assistance administered by each state and territory. HPA includes a range of financial assistance for eligible households to improve their access to, and maintain, home ownership. HPA may vary from state to state and some products are not offered by all states and territories.

HPA can include:

  • direct lending
  • concessional loans
  • mortgage relief
  • interest rate assistance
  • deposit assistance
  • other assistance grants.

In 2019–20, the states and territories provided HPA to almost 43,300 unique households across Australia (Supplementary table HPA.1). There were around 43,700 households receiving any type of HPA, illustrating that households may be provided with more than one type of HPA (Figure FINANCIAL.5) (Supplementary table HPA.2).

Changes over time

The most common form of HPA was direct lending, with almost 38,900 recipients in 2013–14 decreasing to 38,500 in 2019–20. There were fewer households provided with interest rate assistance, but the number has been steadily increasing; from 3,300 in 2013–14 to 3,900 in 2019–20 (Figure FINANCIAL.5) (Supplementary table HPA.2).

Key characteristics of households

Of the 43,300 unique households receiving HPA in 2019–20 (Supplementary table HPA.4):

  • Over one-quarter (27% or 11,500) of households assisted with home purchase had a main applicant aged 35–44 with a further 24% (10,500) aged 25–34. Around 11% (4,800) households had a main applicant aged over 65 years.
  • 1.6% (around 700) were Indigenous households.
  • Over one-fifth (22% or 9,600) were households earning a gross income of less than $700 per week.

State and territory

In 2019–20, HPA was predominantly provided in Western Australia (22,000 unique households or 51%) and South Australia (18,600 or 43%) (Figure FINANCIAL.7) (Supplementary table HPA.1). Direct lending was the main type of HPA assistance in these areas. South Australia was the only state or territory that also offered interest rate assistance (paid to 4,000 or 21% of households) (Supplementary table HPA.2).

Glossary