Social housing dwellings
Figure DWELLINGS.1: Dwellings, by social housing program, at 30 June 2006 to 2020. This vertical stacked bar graph shows that from 2006 to 2020, the most social housing dwellings were consistently in public housing. The number of public housing dwellings decreased from 341,400 (or 84%) in 2006 to 300,400 (or 69%) in 2020. In contrast, the number of community housing dwellings increased from 32,300 (or 8%) in 2006 to 103,900 (or 24%) in 2020. The number of SOMIH dwellings increased from 12,900 (3.2%) in 2006 to 14,600 (3.4%) in 2020. The number of Indigenous community housing dwellings decreased from 22,200 (5.4%) in 2006 to 17,400 (4%) in 2020.
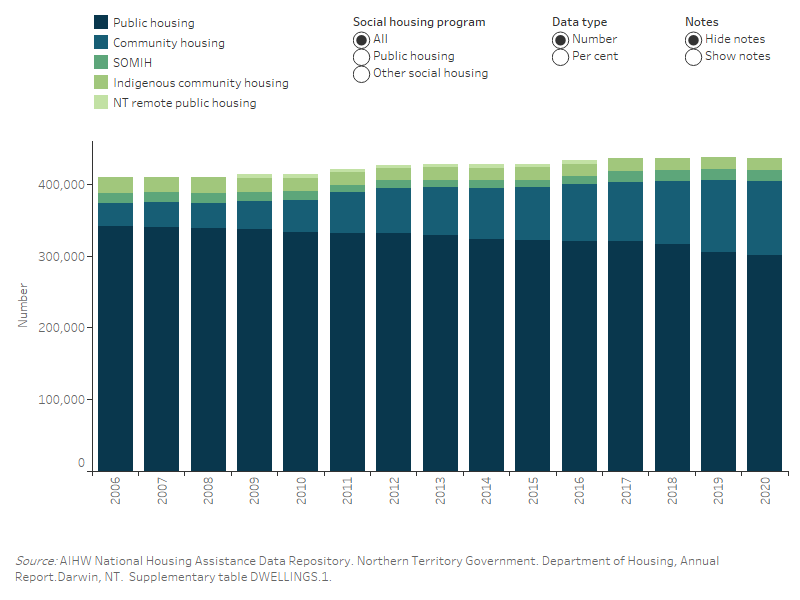
Figure DWELLINGS.2: Dwellings, by social housing program, and states and territories, at 30 June 2014 to 2020. This vertical stacked bar graph shows the variation in dwellings in each social housing program (public housing, SOMIH, community housing and Indigenous community housing) across the states and territories and nationally by the number and per cent. In 2020, the Australian Capital Territory (92%) had the highest proportion of public housing dwellings, while the Northern Territory (40%) had the lowest proportion. In contrast to public housing, Tasmania had the highest proportion of community housing dwellings (49%), while the Northern Territory had the lowest (3.7%), in 2020. Queensland had the highest number of Indigenous community housing dwellings increasing from 5,000 in 2014 to 5,200 dwellings in 2020.
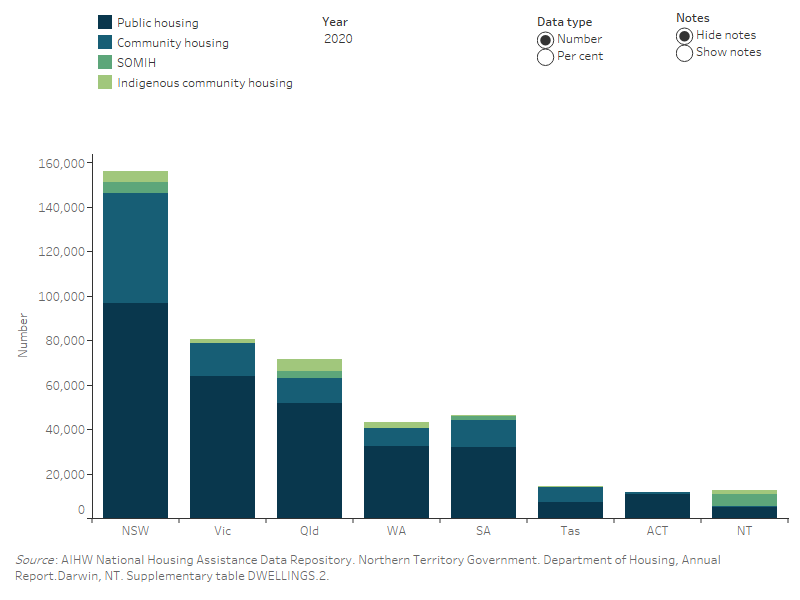
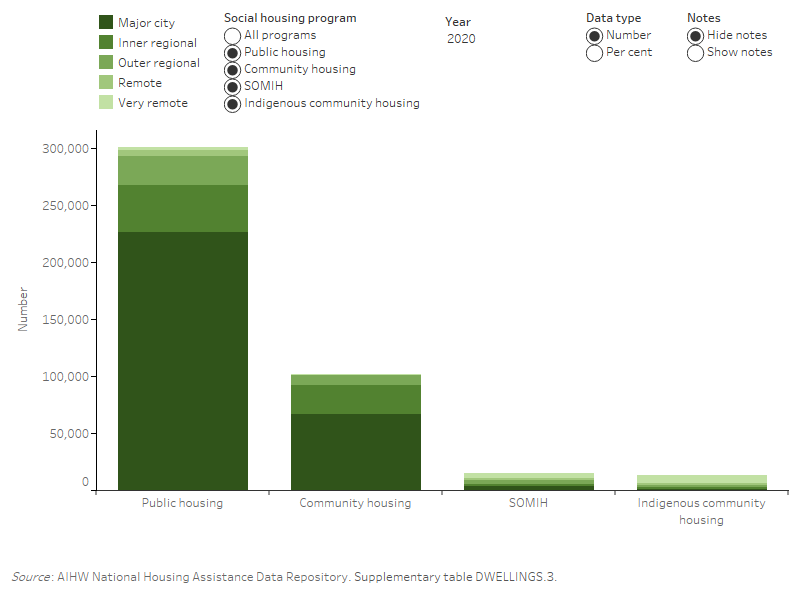
Figure DWELLINGS.3: Dwellings, by social housing program and remoteness area, at 30 June 2014 to 2020. This vertical stacked bar graph shows that for these programs, both the highest number and proportion of dwellings were in Major cities. Between 2014 and 2020, when dwellings of all social housing programs, most dwellings were in Major cities (69–70%) compared with 2.2% to 3.3% in Very remote areas. In 2020, Indigenous community housing had the highest proportion of dwellings in Very remote areas (53%) followed by SOMIH (31%). Community housing (0.4%) and public housing (0.9%) had the lowest proportions in Very remote areas.
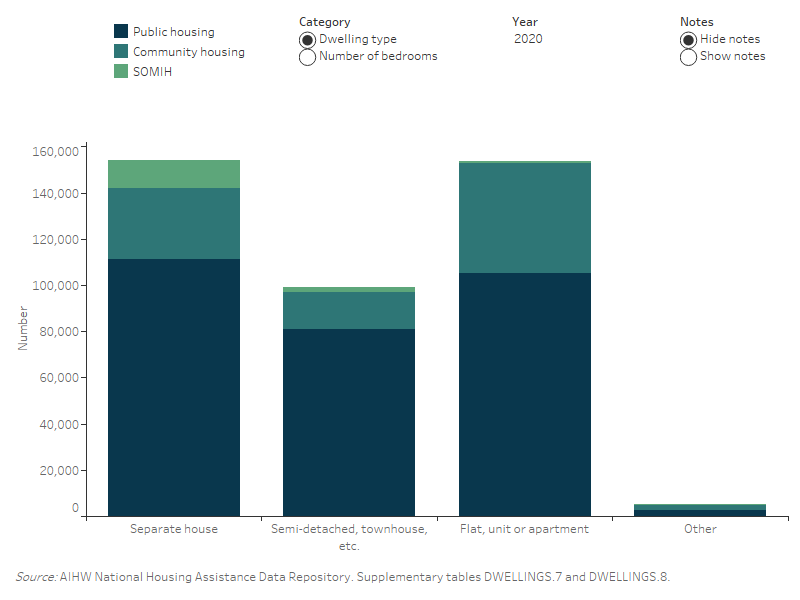
DWELLINGS.4: Dwelling type and number of bedrooms by social housing program, at 30 June 2012 to 2020. This figure consists of two sections with both showing a vertical stacked bar chart of social housing program. The first section shows a comparison of the number of dwellings by dwelling type across social housing programs from 2012 to 2020. In 2020, the most common dwelling type in both public housing (111,400) and SOMIH (12,000) were separate houses, while for community housing the most common dwelling were flats, units or apartments (47,800). The second section shows a comparison of dwellings by number of bedrooms across social housing programs. In 2020, 3 bedroom dwellings were the most common number of bedrooms for public housing (108,900), SOMIH (8,600) and Indigenous community housing (6,500). In contrast, the most common number of bedrooms in community housing (33,700) dwellings were 2 bedrooms, in 2020.