Entries, exits and transfers

Quick facts

  • During 2021–22, 31,700 households were newly allocated to public housing, community housing and SOMIH dwellings, an increase from 29,900 new allocations in 2020–21.
  • The majority of new housing allocations were provided to those in greatest need; 82% of new housing allocations in public housing, 79% in SOMIH and 77% in community housing.
  • For public housing, more than half (58%, or 7,100 households) of the newly allocated greatest need households were experiencing homelessness prior to commencing their public housing tenancy in 2021–22. A further 32% were at risk of homelessness.
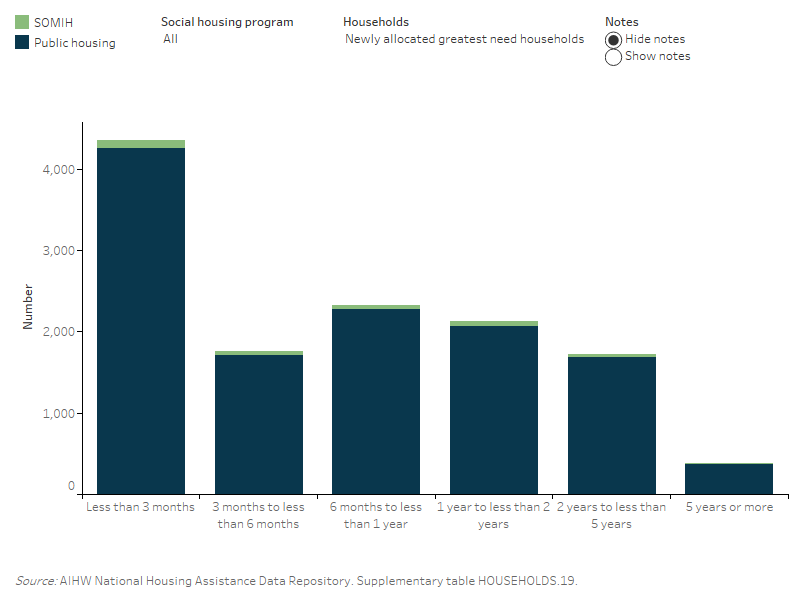
  • Households in greatest need spent less time on waiting lists than other households. Two thirds of greatest need households (67% or 8,200 households) received public housing within one year of the household being on the waiting list, compared to 2 in 5 households without greatest need status (41% or 1,100).


During a collection period, people may be allocated social housing, exit a social housing program, or move from one social housing dwelling to another within the same program (Figure ENTRIES.1). This section presents key data on these entries, exits and transfers.

Data on entries, exits and transfers for Indigenous community housing were not available.

Figure ENTRIES.1: Entries, exits and ongoing households

The diagram shows the relationship between ongoing households at a single point in time (30 June in 2020–21), households entering and exiting social housing over a year (during 2021–22) and ongoing households at a single point in time (on 30 June 2021–22).

Households entering social housing

Allocating social housing to eligible applicants depends on their level of priority (based on need) and dwelling availability. Applicants access to social housing are managed through waiting lists. Generally, when an appropriate dwelling is available, it is offered to high priority applicants first (such as those deemed greatest need or special needs households; see definitions below). The criteria determining applicant eligibility and priority, however, varies by the policies and procedures set by providers in each jurisdiction at a given time. Accordingly, caution must be exercised when making comparisons between states and territories.

The total number of newly allocated households (also referred to as new entries) in 2021–22 increased to 31,700 compared with 29,900 in 2020–21 across public housing, community housing and SOMIH. Of the 31,700 new allocations, approximately half were allocated community housing (51% or 16,100 households); followed by public housing (47% or 15,000 households) and SOMIH (2.0% or 600 households), which is similar to the stock profiles of each housing program. For New South Wales, Queensland, Tasmania and Northern Territory, the number of newly allocated households for public housing in 2021–22 was fewer than all years since 2013–14 (Figure ENTRIES.2, Table HOUSEHOLDS.10).

In recent years, the number of new entries into public housing has been declining, reflecting the declining dwelling stock. In contrast, the number of new entries into community housing has remained relatively stable in recent years, in part due to dwellings transfers from public housing and SOMIH to community housing (Figure ENTRIES.2, Table HOUSEHOLDS.10).

For SOMIH, the number of newly allocated households reached its lowest number in the past decade, falling to 600 in 2021–22 from 1,000 in 2020–21 (Figure ENTRIES.2; Table HOUSEHOLDS.10). However, the number of dwellings in SOMIH was also lower in 2021–22 compared with 2020–21.

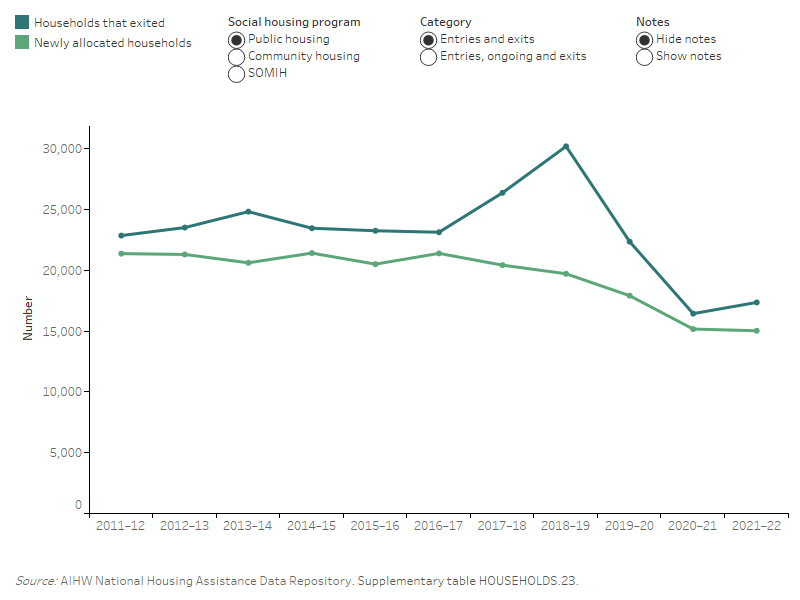
Figure ENTRIES.2: Ongoing households, newly allocated households and exited households, by social housing program, 2011–12 to 2021–22

Figure ENTRIES.2: Ongoing, newly allocated and exited households, by public housing and SOMIH, in 2011–12 to 2021–22. This line graph shows the changes in newly allocated entries, ongoing and exits households from 2011–12 to 2021–22 for public housing and SOMIH. Ongoing households in public housing decreased from 323,400 in 2011–12 to 286,000 in 2021–22 while SOMIH increased from 9,700 in 2011–12 to 13,500 in 2021–22. For public housing, newly allocated households declined from 21,400 in 2011–12 to 15,000 in 2021–22.

Characteristics of newly allocated households

Newly allocated public housing households were mostly single adult (58%) households during 2021–22. Other key characteristics of newly allocated households in public housing for 2021–22 included (Table HOUSEHOLDS.12):

  • the main tenant was female in over half (56%) of the households
  • Over 1 in 4 (26%) households were Indigenous
  • For 1 in 3 (31%) households, the main tenant was aged 55 and over, and 1 in 5 (19%) households with a main tenant aged 29 and under.
  • Over a third (36%) of households had a member with disability.

For SOMIH, newly allocated households during 2021–22 were more likely to be sole parent with dependent children households (39%) compared to group and mixed composition households (29%). In contrast to public housing, only 16% of newly allocated households in SOMIH were single adults and 74% of main tenants were female (Table HOUSEHOLDS.12).

While proportions for each measured characteristic did have some degree of variation between states, all states followed the same general trends for both public housing and SOMIH.

Data on the characteristics of newly allocated households for community housing and Indigenous community housing were not available.

Housing features of new allocations

Housing features of new allocations differed between public housing and SOMIH. The different profiles of new allocations by housing features partly reflect the differences in the types of dwelling type stock available within the programs (see Dwelling attributes). In 2021–22, newly allocated households in the public housing program were more likely to be dwellings with fewer bedrooms (40% were 1 bedroom, 32% were 2 bedrooms, 24% were 3 bedrooms and 4.2% were 4 or more bedrooms) compared to SOMIH (4.1% were 1 bedroom, 22% were 2 bedrooms, 54% were 3 bedrooms and 19% were 4 or more bedrooms) (Table HOUSEHOLDS.14).

Priority groups

Allocation to social housing is determined by policies regarding eligibility, priority groups and entitlement (such as type and location of the property) (Powell et al. 2019). Although income remains the primary eligibility factor for social housing allocation, allocations are also based on an applicant’s circumstances, that is, their need for social housing relative to others on the waiting list (Pawson et al. 2020).

While social housing allocations were historically targeted towards households with a lower income, over time, social housing policies have increasingly focused on supporting vulnerable and complex need applicants, such as applicants experiencing trauma, disadvantage and/or financial instability (Groenhart et al. 2014; Pawson et al, 2020).

As a result, social housing is generally allocated according to priority needs, with allocations made based on identifying those people with the greatest need (such as applicants experiencing homelessness) and those with special needs for housing assistance (such as applicants with disability).

Data on greatest need status for Indigenous community housing were not available.

Greatest need households

Public housing, SOMIH and community housing programs prioritise household allocations through priority waiting lists, such as the greatest need waiting list. The criteria for priority needs varies between jurisdictions, so any comparisons between states and territories must be exercised with caution.

Assessing greatest need status

Greatest need applies to households if, at the time of allocation, household members were subject to one or more of the following circumstances:

  • they were experiencing homelessness
  • they were at risk of homelessness, including:
    • their life or safety was threatened within existing accommodation
    • a health condition was exacerbated by existing accommodation
    • their existing accommodation was inappropriate to their needs
    • they were experiencing very high rental costs.

For more information, see METEOR.

States and territories may use different criteria for classification of greatest need.

Special needs households

Households seeking social housing often have members with special needs. Some households may have one or more members with multiple special needs. The definition of special needs differs across the different social housing programs and between jurisdictions.

Assessing special needs status

For public housing, special needs households include those with:

  • a member with disability,
  • a main tenant younger than 25 years or older than 75, or
  • one or more members who identify as Aboriginal and/or Torres Strait Islander.

As SOMIH is an Indigenous targeted program, Indigenous households in SOMIH are not considered special needs households. For SOMIH, special needs households are only those that have:

  • a member with disability or
  • a main tenant under 25 years or over 50.

New allocations for Greatest need households

Greatest need households accounted for 82% (or 12,400 households) of all newly allocated public housing households in 2021–22 (Figure ENTRIES.3; Table HOUSEHOLDS.15).

Figure ENTRIES.3: Newly allocated households by greatest need status and social housing program, 2009–10 to 2021–22

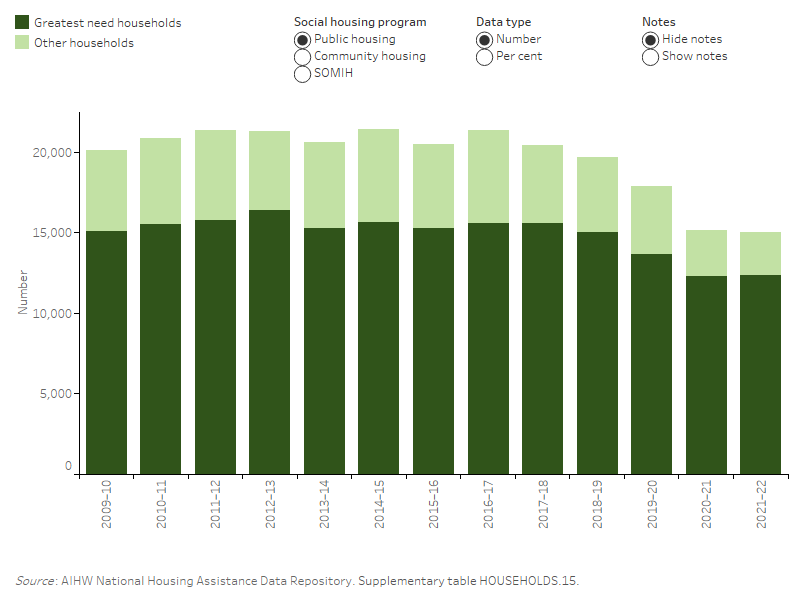
This vertical stacked bar graph shows, for public housing, community housing and SOMIH, there were more newly allocated greatest needs households than other households, from 2009–10 to 2021–22. In 2021–22, the majority of new public housing allocations were provided to households in greatest need (82%). In 2009–10, 71% of newly allocated SOMIH dwellings were provided to households in greatest need; this increased to 79% in 2021–22. Housing allocations to greatest needs households in community housing was 77%.

Almost 80% (300) of newly allocated SOMIH households were households with greatest need status in 2021–22 (excludes Tasmania and the Northern Territory, as greatest need data were not available) (Figure ENTRIES.3; Table HOUSEHOLDS.15). The proportion of newly allocated SOMIH households with greatest need status was around 60% from 2016–17 to 2018–19 but increased by about 5 percentage points to 65% from 2019–20 to 2020–21. This further increased to 79% in 2021–22, however this large increase reflects changes in the total number of newly allocated households within SOMIH, rather than in an increase in the number of greatest need households.

Main reason for greatest need

In 2021–22, of the 12,400 newly allocated public housing households in greatest need (Figure ENTRIES.4; Table HOUSEHOLDS.16):

  • 58% (7,100 households) were experiencing homelessness at the time of allocation; rising by 10 percentage points compared to 2018–19.
  • 32% (4,000 households) were at risk of homelessness, of those households:
    • About 1 in 6 (17% or 2,100) reported the main reason for their greatest need was because their life or safety was at risk in their accommodation.
    • Around 1 in 10 (11% or 1,400 households) reported a health condition aggravated by housing as their main reason for greatest need.

Figure ENTRIES.4: Newly allocated households in greatest need by main reason for greatest need and social housing program, 2011–12 to 2021–22

This line graph shows the main reason for greatest need of newly allocated households. In 2011–12, the main reason for greatest need in public housing was homelessness (55%); this increased to 58% in 2021–22. Of those at risk of homelessness in public housing in 2011–12, the most common main reason for greatest need was because their health condition was aggravated by housing (15%); in 2021–22, the common main reason was because their life or safety was at risk in accommodation (17%).

Data on the main reason a household was in greatest need is not collected for community housing. Based on available data, in 2021–22, more newly allocated greatest need community housing households were experiencing homelessness (52%) than being at risk of homelessness (46%) (Figure ENTRIES.4; Table HOUSEHOLDS.16).

New allocations for special needs households

Data on special needs were available for public housing, SOMIH and community housing. A household may have more than one special needs reason. In 2021–22, there were 9,400 newly allocated public housing households with special needs, representing 62% of all newly allocated households. Of these (Table HOUSEHOLDS.18):

  • over half (58%, or 5,400 households) had at least one member with disability
  • 2 in 5 (42%, or 3,900 households) had at least one Indigenous member
  • almost 1 in 6 (16%, or 1,500 households) had a main tenant aged under 25
  • 7% (or 600 households) had a main tenant aged 75 or over.

In 2021–22, of the almost 300 newly allocated SOMIH households with special needs:

  • 1 in 2 (49%, or 140 households) had a main tenant aged 50 and over
  • 3 in 10 (30%, or 90 households) had a main tenant aged under 25 years
  • Over a third (35%, or 100 households) contained at least one member with disability.

Greatest and special needs households

Greatest and special needs categories are not mutually exclusive, as one or more household members may be eligible within each priority group and between priority groups. Households with members in both greatest and special needs groups may be some of the most vulnerable households and may require high levels of care and support.

In 2021–22, of the newly allocated households in public housing (Figure HOUSEHOLDS.4; Table HOUSEHOLDS.17):

  • over 1 in 2 (53%, or 8,000 households) were both greatest need and special needs households
  • 1 in 5 (22% or 3,300 households) were greatest need only (no special needs)
  • 800 (5.2%) were neither greatest need nor special needs households.

In 2021–22, of the newly allocated households in SOMIH:

  • around 1 in 4 (23%, or 140 households) were both greatest need and special needs households
  • 1 in 4 (24%, or 150 households) were greatest need only (no special needs)
  • around 4.6% (or 30 households) were neither greatest need nor special needs.

Note that greatest need information for SOMIH was unavailable for Tasmania and the Northern Territory.

Time waited for social housing allocation

The time waited by applicants is influenced by dwelling availability (including the size of dwelling needed) and priority group status (greatest need or special needs) (Powell et al. 2019). Since households with priority group status (such as people experiencing homelessness or a disability) are placed ahead of households without priority group status, the number of households with priority group status may influence the amount of timed waited for social housing allocation. Additionally, the time waited for social housing programs can vary both between and within jurisdictions, as the time waited for social housing in high demand city areas are often far greater than other areas (NSW Government 2018; Powell et al. 2019).

The method used to calculate the amount of time waited for a housing allocation varies depending on household priority status. For households in greatest need, the time waited is calculated from the date applicants were determined to be of greatest need (priority group status) and the amount of time that passed before they were allocated housing. In other words, time waited is the amount of time between the greatest need determination and housing allocation.

For households not in greatest need, however, the time waited is calculated from the housing application date to housing allocation – this includes special needs only households. Hence, the time waited is measured here as the amount of time between the housing application and housing allocation.

Data on time waited for housing allocation were unavailable for both community housing and Indigenous community housing.

In 2021–22 (Table HOUSEHOLDS.21)

  • Of all newly allocated public housing households:
    • Almost half (46%) of households were allocated housing within 1 year; 43% waited 1 to 5 years and 11% waited 5 years or more for housing allocation.
    • About one third (32%) of couples with dependent children and single adults were allocated housing in less than 6 months, similar to that of group and mixed composition households (30%).
  • Of all newly allocated SOMIH households:
    • Over half (55%) of households were allocated housing in less than 1 year; 37% waited 1 to 5 years and 7.2% waited 5 or more years for housing allocation.

Over half (54%) of group and mixed composition households were allocated housing in less than 6 months.

Greatest need and time waited for housing allocation

Greatest need status prioritises housing allocation to households with a relatively higher need for housing than other households. For greatest need households, time waited is the amount of time between the greatest need determination and housing allocation. For more detailed information, see the Priority groups section.

In 2021–22, among newly allocated households (Figure ENTRIES.2, Table HOUSEHOLDS.19):

  • For public housing, greatest need households were more likely to be allocated housing within a year.
    • 2 in 3 greatest need households (67%, or 8,200 households) received housing within one year, compared to 2 in 5 households without greatest need status (41% or 1,100).
    • The proportion of newly allocated greatest need households receiving housing (34%) who waited less than 3 months for housing allocation was higher than proportion of households without greatest need status (22%).
  • Households without greatest need status were more likely to spend 2 years or more on the waiting list before receiving a public housing allocation (38% or 1,000), compared to households with greatest need status (17% or 2,100).

For SOMIH, newly allocated households with greatest need status were generally allocated housing faster than households without. In 2021–22 (Figure ENTRIES.5; Table HOUSEHOLDS.19):

  • Around 2 in 3 (or 67%) of newly allocated SOMIH households in greatest need waited less than 1 year
  • 53% of newly allocated SOMIH households without greatest need status waited less than 1 year.

Figure ENTRIES.5: Time waited by newly allocated households by greatest need status and public housing and SOMIH, 2021–22

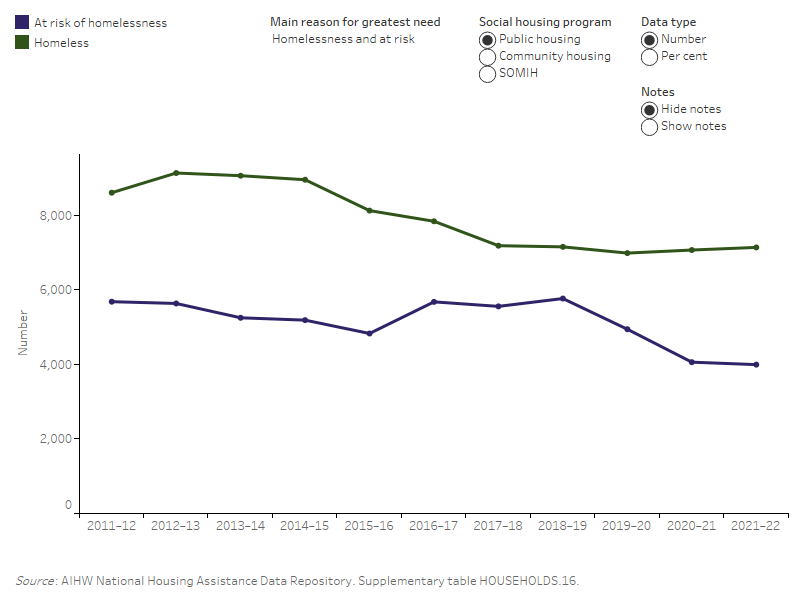
Figure ENTRIES.5: Time waited of newly allocated households, by greatest need status for public housing and SOMIH, 2021–22. The stacked bar graph shows the highest number of newly allocated greatest need household in both public housing (4,300) and SOMIH (100) waited less than 3 months before being allocated housing. For public housing (570) the highest number of newly allocated other households waited less than 3 months before being allocated housing. For SOMIH over half of newly allocated other households (40) waited less than a year before being allocated housing.

Special needs and time waited

Households seeking assistance from social housing providers often have members with special needs. Some households may have multiple special needs. The definition of special needs is different for different social housing programs. For more detailed information, see Priority groups section.

In 2021–22, the time special needs households waited for an allocation of public housing varied, with around (Table HOUSEHOLDS.20):

  • 1,800 (19%) households waited for less than 3 months
  • 2,300 (25%) households waited between 3 months and less than 1 year
  • 4,100 (44%) households waited between 1 year to less than 5 years, and

1,100 (or 12%) households waited for more than 5 years.

Number of bedrooms and time waited

The time waited for social housing allocation varied depending upon the number of bedrooms required by a household and by program. For public housing, the amount of time waited was similar regardless of the number of bedrooms. For SOMIH, 41% of households requiring 4 or more bedrooms waited less than 3 months (Table HOUSEHOLDS.22).

Households exiting social housing

Social housing 'Exits' refers to households that have exited a specific housing program during the reference year. Households that relocate within the same housing program are not considered ‘exits’, but are instead known as ‘transfers’.

Households may exit social housing for a variety of reasons. Some households exit because of changes to their housing or neighbourhood needs, such as those related to location, size, or neighbourhood safety (Johnson et al. 2019). Whereas others exit social housing for financial or forced reasons, including employment opportunities, entry into home ownership, eviction, or ineligibility due to an increase in income (Baker et al. 2020, 2021). In this way, reasons influencing households exits from social housing can be both positive and negative (Wiesel et al. 2014). While exiting households most commonly enter the private rental market, some also enter home ownership or other tenure types, such as employer provided housing (Baker et al. 2020, Bentley et al. 2018). This information is not captured in the datasets informing this report.

In 2021–22, exits from public housing and SOMIH decreased compared to previous years, with around 17,400 public housing households and 1,100 SOMIH households having exited. Across the states and territories, Queensland (3,300 entries and 2,900 exits), Western Australia (2,200 entries and 2,000 exits) and the South Australia (1,900 entries and 1,800 exits) had more new allocations to public housing than exits from public housing (Tables HOUSEHOLDS.10 and 25).

In 2021–22, more households exited SOMIH (1,100) than the previous year (900). The number of households exiting SOMIH in 2021–22 was higher than the number of newly allocated households (600) (Table HOUSEHOLDS.23).

Households transferring dwellings

Transfers occur when occupants move to a dwelling in the same social housing program. Transfers may be initiated by either the tenant (including a mutual swapping of properties between eligible tenants) or housing provider in response to a change in circumstance or housing need. This may include household composition changes (such as overcrowding or underutilisation), a medical condition or because of stock renewal and re-development. Transfer eligibility and implementation varies by jurisdiction and housing program.

During 2021–22, 6,900 (2.3%) of public housing households and 300 (1.9%) of SOMIH households transferred – or were relocated – to a different dwelling within the same housing program (Table HOUSEHOLDS.25).

Figure TRANSFERS AND EXITS.1: Households by transfer and exit status, public housing and SOMIH, by states and territories, 2011–12 to 2021–22

This vertical bar graph shows that nationally the number of public housing and SOMIH households that exited were higher than those that transferred, from 2011–12 to 2021–22. In 2011–12, 22,900 public housing households exited, and 8,200 households transferred; in 2021–22, households that exited decreased to 17,400 and households that transferred decreased to 6,900. In 2011–12, around 600 SOMIH households exited and 300 transferred; in 2021–22, households that exited increased to 1,100, while those that transferred remained at 300.