Were tenants satisfied with maintenance services?
On this page:
- Social housing tenants were more satisfied with emergency maintenance services
- Public housing: satisfaction with maintenance has decreased
- SOMIH: satisfaction with maintenance was variable
- Community housing: decreased satisfaction with maintenance services
- Tenants living in homes with structural problems
Receiving quality maintenance services in a timely matter is of great importance to social housing tenants. Tenants were surveyed on their satisfaction with both day to day and emergency maintenance services. Note: There is variability in the scope of what is included in maitenance services between and within housing programs.
NSHS questions about tenants’ satisfaction with maintenance services
Information about social housing tenants’ satisfaction with the maintenance services provided by their housing organisation was obtained from responses to the following questions.
In the last 12 months, how satisfied were you with:
- the day to day maintenance services provided by your housing organisation?
- the emergency maintenance services provided by your housing organisation?
Survey respondents selected either Very satisfied, Satisfied, Neither satisfied nor dissatisfied, Dissatisfied, Very dissatisfied, or Not applicable.
Satisfied refers to satisfied or very satisfied.
The term Satisfaction rate refers to the proportion of social housing tenants who were satisfied with maintenance services (emergency or day to day services, as described).
Social housing tenants were more satisfied with emergency maintenance services
'The emergency maintenance (such as a blocked toilet) is fixed no worries but anything else that falls into general maintenance never gets done.'
'Some maintenance has still not yet been completed 12 months since being raised. The quality of some maintenance work performed is not of high quality.'
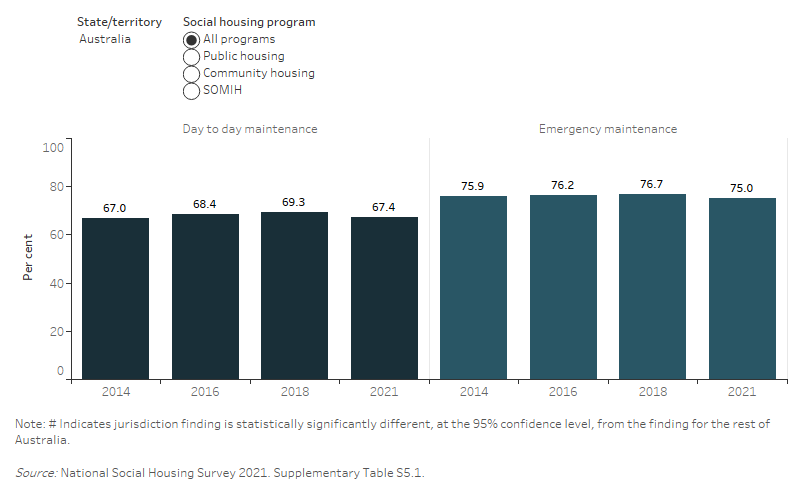
Across all programs, a larger proportion of social housing tenants were satisfied with the emergency maintenance services (75%) provided by their housing organisation than with day to day maintenance services (67%) (Figure Maintenance.1, Table S5.1).
Among public housing tenants, satisfaction rates with day to day maintenance services and emergency maintenance services remained relatively unchanged from 2014 to 2021 (Figure Maintenance.1, Table S5.1). Satisfaction among community housing tenants for both day to day and emergency maintenance services decreased between 2014 to 2021.
In 2014, the satisfaction rate of SOMIH tenants’ with both day to day and emergency maintenance services was much lower than the other housing programs, but satisfaction has steadily increased over time, with satisfaction with emergency maintenance services increasing from 64% in 2014 to 73% in 2021 and from 48% to 62% for day to day maintenance.
'Satisfied with emergency maintenance, the system works well, i.e. reference number, number of days. Dissatisfied with long term maintenance issues. No clear process. You put in an order and it is never followed up. No communication.'
Public housing tenant
Figure Maintenance.1: Satisfaction with maintenance services (%), by social housing program and maintenance service type, 2014 to 2021
This interactive bar chart shows the tenant satisfaction with day‑to‑day maintenance services was lower than satisfaction with emergency maintenance services. This trend was consistent across housing programs, years, and states and territories.
Public housing: satisfaction with maintenance has decreased
'Not happy about having to make 15 phone calls before problems are fixed. In the last 12 months this has happened more than once.'
Public housing tenants’ satisfaction with maintenance services varied between states and territories in 2021 (Figure Maintenance.1, Table S5.1):
- Queensland and the Northern Territory had the highest satisfaction rate with day to day maintenance services (79%) and the Australian Capital Territory had the lowest (48%).
- Satisfaction rates with day to day maintenance services decreased compared with 2018 among tenants in both Victoria (69% in 2018 to 61% in 2021) and the Australian Capital Territory (62% and 48% respectively).
- Queensland had the highest rate of satisfaction with emergency maintenance services (87%) and the Australian Capital Territory had the lowest (63%).
- Compared with 2014, both the Northern Territory and Western Australia had notable increases in satisfaction with both day to day maintenance services and with emergency maintenance services.
SOMIH: satisfaction with maintenance was variable
'Repair contractors are timely but work is always rushed and often does not completely fix an issue. This means the housing organisation has to be contacted more than once. I have been in this situation several times.'
'Whenever we've called in regards to maintenance, housing always acts quickly to remedy any problems we have had.'
In 2021, Queensland was the only state or territory with satisfaction rates above 75% for both day to day maintenance services (76%) and emergency maintenance services (83%) among SOMIH tenants (Figure Maintenance.1, Table S5.1). Satisfaction rates for both day to day and emergency maintenance services were higher in 2021 compared with 2014 for all states/territories (Figure Maintenance.1, Table S5.1).
Community housing: decreased satisfaction with maintenance services
'I’m dissatisfied as maintenance is not carried out right nor is it done in a satisfactory time frame. If things were fixed the right way the first time, there wouldn't be a need to keep coming back.'
'It seems that this housing service doesn't even have a database that tracks maintenance reports or requests and outcomes of these reports or requests. That is a measure of the true disinterest that the tenant managers have in dealing with issues.'
'My housing service organisation has always responded promptly to maintenance requests. They have followed up with me to make sure the work has been completed and also that that I am happy with the repair. They are easy to communicate with and friendly.'
Tenants in community housing in Western Australia (79%) had the highest satisfaction rate with day to day maintenance services in 2021. Victorian community housing tenants (62%) had the lowest satisfaction rate. New South Wales (66%) and Victoria (62%) had lower satisfaction rates compared with 2018, contributing to a reduced national rate (69% in 2021 compared with 72% in 2018). All other states and territories had stable or increased satisfaction rates compared with 2018 (Figure Maintenance.1, Table S5.1).
Western Australian community housing tenants had the highest satisfaction with emergency maintenance services in 2021 (85%), followed by South Australia (82%). The Australian Capital Territory (70%) was the lowest of all the states and territories (Figure Maintenance.1, Table S5.1).
Tenants living in homes with structural problems
Satisfaction with maintenance services decreased with an increasing number of structural problems. For more robust analysis on the importance of structural problems on overall satisfaction, see the regression analysis.
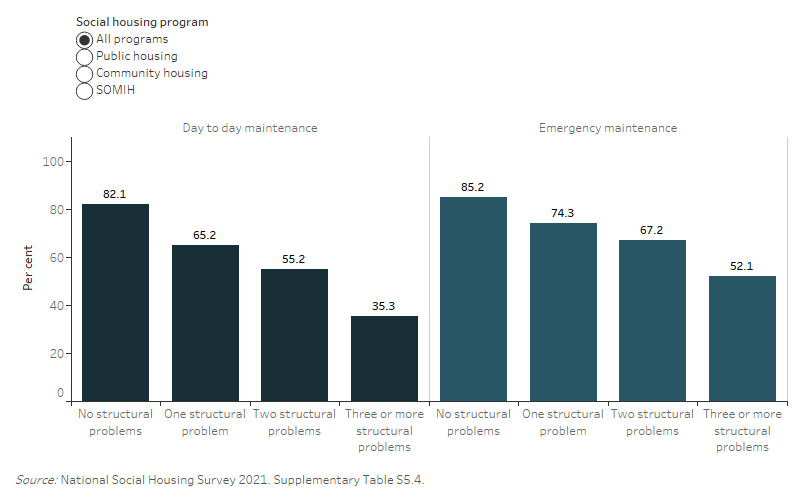
Rates of satisfaction with maintenance services were particularly low among those living in dwellings with multiple structural problems (Figure Maintenance.2, Table S5.4). While the proportions varied between the different social housing programs, the pattern was consistent. Satisfaction rates were highest for tenants living in dwellings with no structural problems and progressively decreased with 1, 2 and 3 or more structural problems. The pattern was more marked with day to day maintenance, with tenants in all housing programs having satisfaction rates below 50% when their dwelling had 3 or more structural problems.
'Doors falling off due to termite damage, semi exposed wiring because of termite damage. Nearly all the skirting boards are eaten out. Hasn't been fixed even though they have been informed about it multiple times over the last few years.'
'They haven't fixed anything in the house-cracks in the walls, cracks in the floors, roof leaks, taps don't work in the kitchen. Rang about this months ago.'
Figure Maintenance.2: Satisfaction with maintenance services (%), by social housing program and number of structural problems in the dwelling, 2021
This interactive bar chart shows the tenant satisfaction with maintenance services was lower when there were more structural problems with the residence. This trend was consistent for both day‑to‑day maintenance and emergency maintenance and within each housing program.