Summary
Households in public rental dwellings at 30 June 2008
In total, 331,136 households lived in public rental dwellings at 30 June 2008. This included 23,953 Indigenous households, which represented 7% of all households. Indigenous households are also accommodated in state owned and managed Indigenous rental housing–in 2007-08 this included a further 12,375 households (AIHW 2009).
Of all 331,136 households, 291,137 (88%) received a rental rebate. That is, they paid less than market rent for the dwelling (referred to hereafter as 'rebated households'). The remaining 39,999 households (12%) paid market rent. Of the 290,266 rebated households for which complete rent and income details were known, 82% paid more than 20% but no more than 30% of their income in rent, while 18% paid 20% or less of their income in rent.
The average weekly rental subsidy for rebated households for the week of 30 June 2008 was $109 per household.
Of the 306,659 households occupying public rental dwellings for which tenancy composition and dwelling details were known, 20,566 (7%) were moderately overcrowded and 5,197 (2%) were overcrowded (that is, required one additional bedroom or at least two additional bedrooms, respectively1). A further 35,681 (12%) were underutilised (that is, had two or more bedrooms than were required to meet the standard).
New allocations to public rental housing during 2007-08
During the period 1 July 2007 to 30 June 2008, 23,731 households were newly assisted with public rental housing. Of these households, 12,105 (51%) were classified as being in 'greatest need' (see Section 3.3.6).
Of the 23,627 new allocations for which allocation details were known, 7,758 households (33%) were assisted within 3 months of application and 6,008 (25%) were allocated housing 2 years or more after application (Figure 1).
Of the 12,105 new allocations of public rental housing to households in greatest need, around half (48%) were assisted within 3 months of application. The proportion of greatest need households allocated housing in a given time period decreases as the time between application and allocation increases, with only 3% still waiting 2 years or more after application (Figure 1).
There were 3,556 Indigenous households allocated public rental housing during 2007-08, representing 15% of all new allocations for the period.
Figure 1: New allocations of public rental housing to households in greatest need and all households, by time to allocation, 2007-08
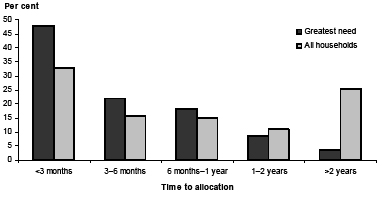
Source: Table 2.8.
Households waiting for public rental housing at 30 June 2008
A total of 177,652 households were on waiting lists for public rental housing at 30 June 2008, of which 14,638 households were classified as being in 'greatest need'. This represents 8% of all households on waiting lists.
Public rental dwellings at 30 June 2008
In total, state and territory housing authorities managed 337,866 dwellings at 30 June 2008, of which 331,136 were occupied. This represents an occupancy rate of approximately 98%.
Of all 337,866 public rental dwellings, 4,277 (1%) were untenantable or undergoing major redevelopment, while the remaining 333,589 (99%) were considered tenantable. Figure 2 provides a breakdown of untenantable dwellings by jurisdiction.
Figure 2: Untenantable public rental dwellings, by jurisdiction, 30 June 2008
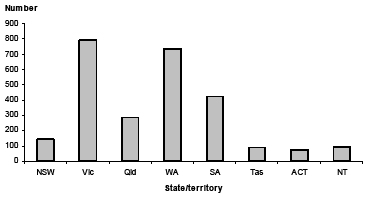
Source: Table 2.1.
Figure 3 provides the Australian Standard Geographical Classification (ASGC) of remoteness of public rental dwellings, broken down by jurisdiction. Nationally, 73% of all public rental dwellings were located in Major cities, 16% were located in Inner regional Australia, 9% were located in Outer regional Australia, and 2% were located in Remote and very remote areas of Australia.
Figure 3: Public rental dwellings, by Australian Standard Geographical Classification of remoteness, by jurisdiction, 30 June 2008
Source: Table 2.1.