Alcohol use
The consumption of alcohol is widespread in Australia and entwined with many social and cultural activities.
Current use and trends
There were some changes in people’s drinking patterns in 2016
Compared to 2013, people were drinking less frequently in 2016. A significantly lower proportion drank daily or at least weekly and a significantly higher proportion drank less often than weekly (2 to 3 days a month, once a month, or less often than once a month) (Table 14). These changes were mainly driven by males (fewer drinking daily or weekly and more drinking less often than weekly) (Table 15).
There were no changes in the proportion of people aged 14 years or older never drinking or quitting drinking between 2013 and 2016; although the proportion of never drinkers slightly increased, the increase was not significant (13.8% to 14.5%).
Young people continued to drink less
Fewer people aged 12–17 drank alcohol in 2016—the proportion abstaining from alcohol significantly increased from 2013 to 2016 (from 72% to 82%) (Table 17).
People aged 14–24 continued to delay starting drinking—the age they first tried alcohol has increased since 1998 from 14.4 to 16.1 years in 2016 (significant increase from 15.7 years in 2013) (Table 21).
Risky drinking
Lifetime risky drinkers are defined as people who consume more than 2 standard drinks per day (on average over a 12 month period). Single occasion risky drinkers are defined as people consuming 5 or more standard drinks on a single drinking occasion.
Box 1: The Australian guidelines to reduce health risks from drinking alcohol
The alcohol risk data presented here are reported against guideline 1 and guideline 2 of The Australian guidelines to reduce health risks from drinking alcohol released in March 2009 by the National Health and Medical Research Council.
Guideline 1: Reducing the risk of alcohol-related harm over a lifetime
The lifetime risk of harm from drinking alcohol increases with the amount consumed.
For healthy men and women, drinking no more than two standard drinks on any day reduces the lifetime risk of harm from alcohol-related disease or injury.
Guideline 2: Reducing the risk of injury on a single occasion of drinking
On a single occasion of drinking, the risk of alcohol-related injury increases with the amount consumed.
For healthy men and women, drinking no more than four standard drinks on a single occasion reduces the risk of alcohol-related injury arising from that occasion.
Fewer people exceeded the lifetime risk guideline but there was no change in the proportion exceeding the single occasion risk guideline
- Drinking in excess of the recommended lifetime risk guideline continued to decline in 2016—from 18.2% in 2013 to 17.1% in 2016, continuing a downward trend since 2004 (21%) (Figure 5).
- The proportion exceeding the single occasion risk guideline at least once a month remained unchanged in 2016 at around 1 in 4.
Figure 5: People aged 14 years or older, drinking alcohol at risky levels or abstaining, 2001 to 2016 (per cent)
. The proportion of abstainers remains stable in 2016 after an increase in 2013, while the proportion of people exceeding single occasion risk remains stable in 2016 after a decrease in 2013.")
Source: National Drug Strategy Household Survey (NDSHS) 2016 preliminary findings (Data tables).
Lifetime risk
Males were more than twice as likely as females to exceed the lifetime risk guidelines in 2016 (24% compared with 9.8%). However, the difference is narrowing as fewer males drank at risky levels in 2016 (significantly declined from 26% in 2013 to 24%) while female risky drinking remained unchanged (10.0% to 9.8%) (Table 17).
Most age groups show a declining longer-term trend in the proportion exceeding the lifetime risk guidelines except for people aged 50 or older.
There were some noticeable changes in drinking patterns by age and sex
Considerable improvement was made among teenagers (12–17 year olds) with the proportion abstaining significantly increasing between 2013 (72%) and 2016 (82%), (up from 56% in 2007).
Since 2010, young adults (18–24 year olds) have reduced their consumption of alcohol with fewer young adults exceeding the lifetime risk guidelines (from 31% to 18.5% in 2016). This has been driven by both an increase in those abstaining and an increase in those drinking at levels considered to be at low risk to health over the lifetime (on average, had no more than 2 drinks per day).
The female age group most likely to exceed the lifetime risk guidelines has changed
The 18–24 year old cohort has historically (since 2007) been the female age group most likely to drink more than 2 standard drinks per day average. But average daily consumption of alcohol in this age group has considerably reduced over time, from 20% in 2007 to 12.8% in 2016 (Figure 5). Over the same period, drinking in excess of the lifetime risk guideline has been gradually increasing among the 50–59 year old age group (from 11.2% in 2007 to 13.0% in 2016) and in 2016, was slightly higher than the proportion of 18–24 year olds exceeding the lifetime risk guideline.
Figure 6: Proportion of females exceeding the lifetime risk guidelines(a), by age, 2007 to 2016 (per cent)

a. on average consumed more than 2 standard drinks per day
Source: NDSHS 2016 preliminary findings (Data tables).
Younger males continue to improve their drinking habits but no changes for middle aged men
A similar pattern is seen among males. Younger age groups up to about the age of 40 have improved, and older groups aged 40 and over have not changed (Figure 7).
- Males aged 18–24 in 2016 were far less likely to exceed the lifetime risk guidelines as 18–24 year olds in 2007 (23% in 2016 compared with 39% in 2007).
- About 3 in 10 males in their 40s, 50s and 60s exceeded the lifetime risk guidelines in 2016, and similar proportions were reported in 2007, 2010 and 2013.
- The age group most likely to exceed the guidelines in 2016 was males aged 40–49. However, the proportions were fairly similar across males aged 25 to 69, ranging from 25% for males in their 30s to 29% for males in their 40s.
Figure 7: Proportion of males exceeding the lifetime risk guidelines(a), by age, 2007 to 2016 (per cent)

a. on average consumed more than 2 standard drinks per day.
Source: NDSHS 2016 preliminary findings (Data tables).
Single occasion risk
There were similar changes by age and sex in the proportion of people consuming 5 or more standard drinks on a single drinking occasion on a monthly basis:
- Young people continued to make significant improvements with both 12–17 year olds and 18–24 year olds reporting significant declines from 2013 to 2016. However, no improvements were made among the older age groups (people aged 30 or older) (Figure 8).
- Teenage males (12–17 years) and young adult males (18–24 years) reported declines between 2013 and 2016 (from 10.8% to 5.9% and 53% to 46% respectively) (Table 18).
- There were no significant declines seen among females exceeding the single occasion risk guidelines and a significant increase was reported among females in their 30s (from 17.2% to 21%).
Figure 8: Proportion exceeding the single occasion risk(a) guideline (at least monthly), by age, 2001 to 2016 (per cent)

a. Had more than 4 standard drinks at least once a month.
Source: NDSHS 2016 preliminary findings (Data tables).
Very high risk drinking increasing among older people
The consumption of 11 or more standard drinks (very high risk) on one drinking occasion in the last year has declined among young people since 2010 (12–17 year olds and 18–24 year olds) but increased among the older age groups (Figure 9).
Between 2013 and 2016, people in their 50s and 60s both reported a significant increase in the proportion consuming 11 or more standard drinks on a single drinking occasion in the last year (from 9.1% to 11.9% and from 4.7% to 6.1% respectively). However, people in their late teens and 20s were still far more likely to have consumed 11 or more drinks in one sitting than people in their 50s and 60s.
Figure 9: Consumed 11 or more drinks at least once in the last year, by age, 2010 to 2016 (per cent)
 on one drinking occasion in the last year. It shows that since 2010, declines are mostly occurring in age groups under 40 years and that among older age groups the proportions are stable or increasing.")
Source: NDSHS 2016 preliminary findings (Data tables).
Harm
Experience of any alcohol-related incidents decreased
- About 4.4 million people in Australia (22%) reported being a victim of an alcohol-related incident in 2016, declining from 4.9 million (26%) in 2013.
- There were fewer people being verbally abused, physically abused or put in fear by someone under the influence of alcohol in 2016—all incidents significantly declined between 2013 and 2016 (Figure 10).
Figure 10: People aged 14 or older experiencing alcohol-related incidents, 2007 to 2016
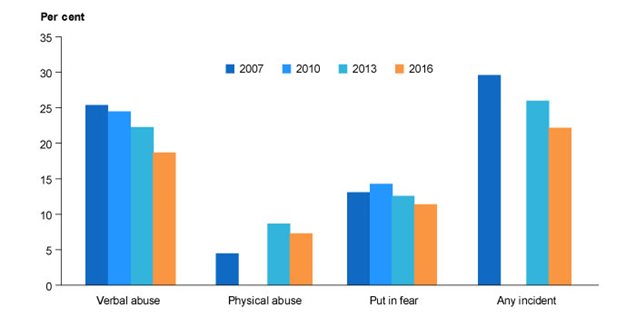
Source: NDSHS 2016 preliminary findings (Data tables).
Community concern and support
- Most alcohol policy measures received lower levels of support in 2016 than in 2013 (13 out of 18 measures) and none received higher levels of support (Table 23).
- The largest proportional decrease was for 'reducing the trading hours for pubs and clubs' (from 47% to 39%). This measure received the third lowest level of support after 'increasing the price of alcohol' (28%).
- Alcohol was the drug most commonly mentioned as causing the most drug-related deaths in 2016 (35%), higher than tobacco (24%) (Table 41).
- There was a considerable decrease in the proportion of people nominating excessive drinking of alcohol as the drug of most concern for the general community (from 43% in 2013 to 28% in 2016) (Table 42). This was the first time alcohol was not the most commonly mentioned drug (the proportion nominating meth/amphetamines substantially increased over this period).