Spectacles dispensed under state schemes
This chart presents 5 separate charts showing state spectacles schemes, by various characteristics.
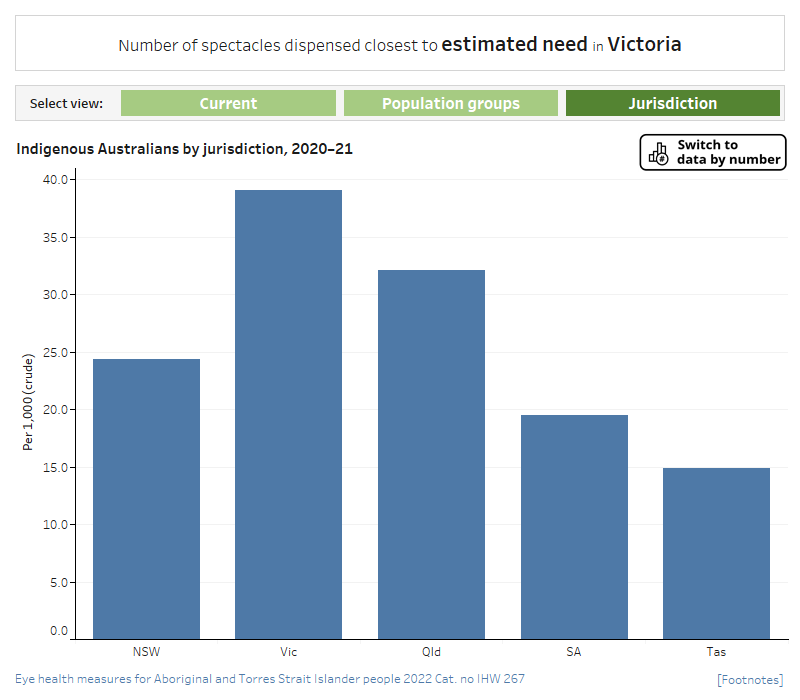
Rate per 1,000 population of spectacles dispensed by jurisdiction, 2020-21
This vertical bar chart compares the rate per 1,000 population of spectacles dispensed in 2020─21 by jurisdiction. The chart shows that Indigenous Australians received glasses under the Victorian state scheme at a rate of 38.9 per 1,000 population. In New South Wales the rate was 24.4 per 1,000 population, in Queensland it was 32.1 per 1,000 population, in South Australia the rate was 19.4 per 1,000 and in Tasmania it was 14.9 per 1,000.
Rate per 1,000 population of spectacles dispensed by age, Vic 2020-21
This vertical bar chart shows the rate per 1,000 of spectacles dispensed to Indigenous Australians in Victoria in 2020–21, by age group. The chart shows that the rate of Indigenous clients receiving glasses under the spectacles program increased with age. The rate was highest among those aged 61 years and over (79 per 1,000) followed by those aged 51–60 years (28 per 1,000).
Rate per 1,000 population of spectacles dispensed by age, Qld 2020-21
This vertical bar chart compares the rate per 1,000 population of spectacles dispensed to Indigenous Australians in 2020–21, by age group, in Queensland. The chart shows that the rate of Indigenous clients receiving glasses under the spectacles program increased with age. The rate was highest among those aged 65 years and over (179 per 1,000) followed by those aged 50–64 years (98 per 1,000).
Rate per 1,000 population of spectacles dispensed by age, SA 2020-21
This vertical bar chart shows the rate per 1,000 of spectacles dispensed to Indigenous Australians in South Australia in 2020–21, by age group. The chart shows that the rate of Indigenous clients receiving glasses under the spectacles program increased with age. The rate was highest among those aged 65 years and over (79.1 per 1,000) followed by those aged 45–64 years (51.5 per 1,000).
Rate per 1,000 population of spectacles dispensed by age, Tas 2020-21
This vertical bar chart shows the rate per 1,000 of spectacles dispensed to Indigenous Australians in Tasmania in 2020–21, by age group. The chart shows that the rate of Indigenous clients receiving glasses under the spectacles program increased with age. The rate was highest among those aged 65 years and over (69.9 per 1,000) followed by those aged 45–64 years (32.6 per 1,000).
Rate per 1,000 population of spectacles dispensed by age and sex, NSW, 2020-21
This grouped vertical bar chart compares the rate per 1,000 population of spectacles dispensed to Indigenous Australians in 2020–21, by age and by sex, in New South Wales. The chart shows that, in New South Wales in this period, in all age groups, higher rates of Indigenous females than males received glasses under the spectacles program. The rates of Indigenous clients who received glasses were highest for males and females aged 65 years and over.
Number of spectacles dispensed and need by jurisdiction, 2020-21
This stacked vertical bar chart compares the number of spectacles dispensed in 2020–21 and the number of Indigenous Australians over 40 requiring glasses in 2020-21, by jurisdiction. The chart shows that 6,912 Indigenous Australians received glasses under the New South Wales state scheme, however, it was estimated that over 18,135 Indigenous Australians over 40 required glasses each year in New South Wales. In Queensland 7,679 adults received glasses under the state scheme, however it was estimated that 15,293 Indigenous Australians over 40 required glasses each year in Queensland. In Victoria 2,454 spectacles were dispensed under the state scheme with an estimated 4,024 requiring glasses. In South Australia 879 spectacles were dispensed under the state scheme with an estimated 2,891 requiring glasses. In Tasmania 449 spectacles were dispensed under the state scheme with estimated 1,926 requiring glasses.