Treated for diabetic retinopathy among those tested for diabetes
There are 5 separate charts for this measure by various characteristics.
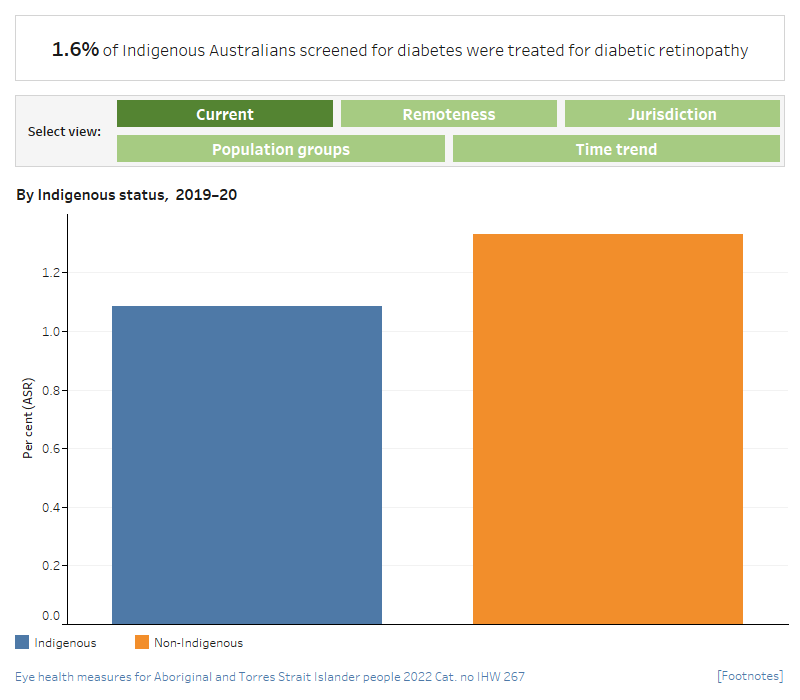
Age standardised proportion of Indigenous Australians screened for diabetic retinopathy treated for diabetic retinopathy by Indigenous status, 2019─20
This vertical bar chart compares the age-standardised proportion of the population screened for diabetic retinopathy who received treatment in 2019–20, by Indigenous status. The age-standardised proportion was 1.1% for Indigenous Australians and 1.3% for non-Indigenous Australians.
Proportion of Indigenous Australians screened for diabetic retinopathy treated for diabetic retinopathy by region, 2019─20
This dual axis combined vertical bar chart and scatter plot displays the proportion and number of Indigenous Australians screened who were treated for diabetic retinopathy in 2019─20, by remoteness status. Point markers display the proportion treated in each remoteness area. The proportion is highest in Major cities (1.9%) and Inner regional and Outer regional areas (both 1.8%), and lowest in Very remote areas 0.6%).
Proportion of Indigenous Australians screened for diabetic retinopathy treated for diabetic retinopathy by jurisdiction, 2019─20
This dual axis combined vertical bar chart and scatter plot displays the proportion and number of Indigenous Australians screened who were treated for diabetic retinopathy in 2019─20, by jurisdiction. Point markers display the proportion treated in each jurisdiction. The highest number treated is in New South Wales (239), but the highest proportion is in the Australian Capital Territory (2.2%). The lowest number treated was in South Australia (16), but the lowest proportion was in the Northern Territory (0.2%).
Proportion of Indigenous Australians screened for diabetic retinopathy treated for diabetic retinopathy, by age and sex, 2019─20
The grouped vertical bar chart displays the proportion of Indigenous Australians screened who were treated for diabetic retinopathy in 2019–20 by age group and by sex. The rate increases with age for males and females across all age groups. The rate for males is higher in all age groups except 65+ years.
Proportion of Indigenous Australians screened for diabetic retinopathy treated for diabetic retinopathy 2010─11 to 2019─20
This dual axis combined line chart and scatter graph shows the proportion of Indigenous Australians screened who were treated for diabetic retinopathy, from 2010─11 to 2019─20. Point markers display the percentage treated, while the line displays the number treated in each time period. The proportion increased from 1.3% in 2010–11 to 1.6% in 2019–20, as did the number receiving treatment going from 351 to 506.