Waiting times for elective cataract surgery (percentile)
There are 3 separate visualisations for this measure showing data by region, jurisdiction and year. The region and jurisdiction visualisations contain two grouped vertical bar charts stacked vertically, one for waiting time at the 50th percentile and the other at the 90th percentile. The time trend visualisation contains two line graphs stacked on top of each other.
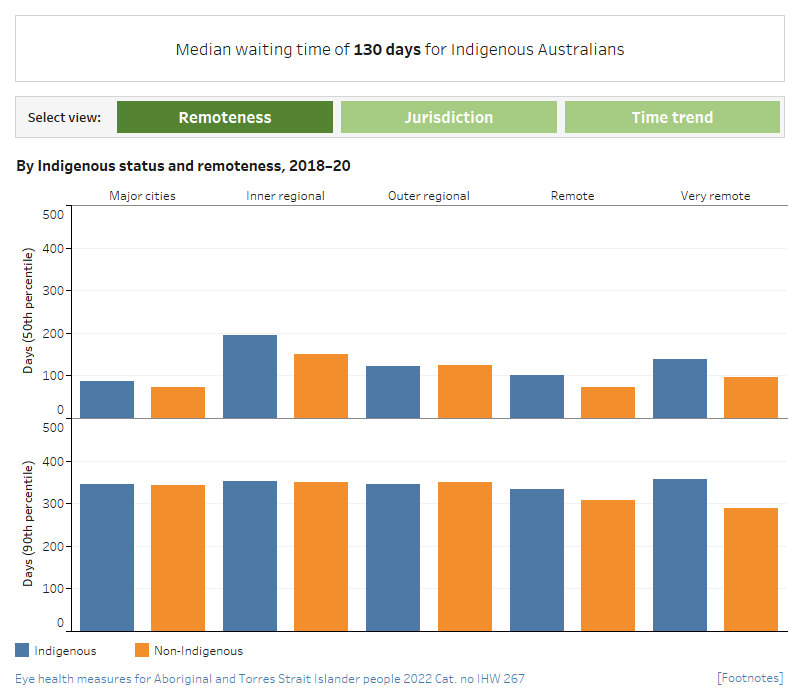
Waiting times for elective cataract surgery by Indigenous status and region, 2018-20
This bar chart shows the days waited at the 50th percentile for elective cataract surgery, in 2018–20, by Indigenous status and region. The chart shows that the median waiting time, or time waited before 50% of Indigenous patients were admitted for cataract surgery, was higher for Indigenous Australians across all regions with the exception of Outer regional areas where the wait times for Indigenous Australians was slightly less than that for non-Indigenous Australians (123 and 124 days, respectively).
This bar chart shows the days waited at the 90th percentile for elective cataract surgery in 2018–20, by Indigenous status and region. The chart shows the time waited before 90% of Indigenous patients were admitted for cataract surgery, was longer for Indigenous Australians in across all regions with the exception of Outer regional areas where the wait times for Indigenous Australians was slightly less than that for non-Indigenous Australians (346 and 349 days, respectively).
Waiting times for elective cataract surgery by Indigenous status and jurisdiction, 2018-20
This bar chart shows the days waited at the 50th percentile for elective cataract surgery, in 2018–20, by Indigenous status and jurisdiction. The chart shows that the median waiting time, or time waited before 50% of Indigenous patients were admitted for cataract surgery, was lower for Indigenous Australians in NSW and SA and higher in all other jurisdictions.
This bar chart also shows the days waited at the 90th percentile for elective cataract surgery in 2018–20, by Indigenous status and jurisdiction. The chart shows the time waited before 90% of patients were admitted for cataract surgery, was shorter for non-Indigenous Australians in all jurisdictions except Victoria and the NT.
Waiting times for elective cataract surgery by Indigenous status, 2012-13 to 2019-20
This line graph shows the days waited at the 50th percentile for elective cataract surgery, from 2012–13 to 2019–20, by Indigenous status. The chart shows that the median waiting time, or time waited before 50% of Indigenous patients were admitted for cataract surgery, was consistently longer than that for non-Indigenous Australians (in 2019–20 this was 130 days and 95 days, respectively).
This line graph also shows the days waited at the 90th percentile for elective cataract surgery, from 2012–13 to 2019–20, by Indigenous status. The chart shows the time waited before 90% of Indigenous patients were admitted for cataract surgery, was consistently longer than that for non-Indigenous Australians (in 2019–20 this was 354 days and 351 days, respectively).