Differences by remoteness
Geographical distribution
Most Indigenous Australians live in non-remote areas (79% in 2011) rather than remote areas (21%). By comparison, 98% of non-Indigenous Australians live in non-remote areas, while 2% live in remote areas.
Indigenous and non-Indigenous population, by remoteness, 30 June 2011
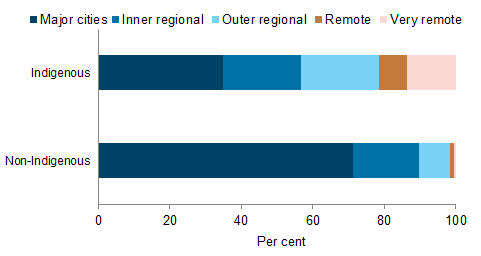
Of all people living in remote areas, the proportion who are Indigenous is relatively high. In 2011, 45% of people living in Very remote areas and 16% of people living in Remote areas were Indigenous.
Economic participation
Economic participation refers to an individual’s engagement in work and/or education, and their access to economic resources that results from such participation.
In 2013, preschool attendance in the year before full-time schooling among Indigenous children was higher in Remote and very remote areas (75%) than in Major cities (65%) and regional areas (71%).
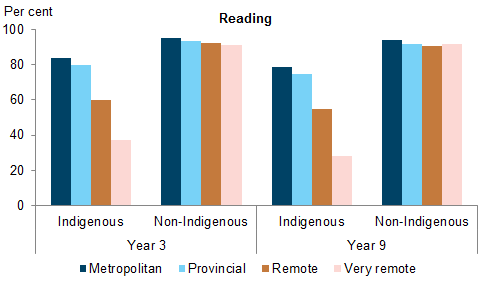
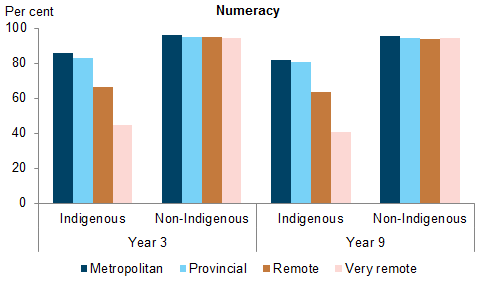
Information on student’s literary and numeracy levels are assessed in Australia annually through National Assessment Program—Literacy and Numeracy (NAPLAN) tests. These tests are conducted in May for all students in Years 3, 5, 7 and 9 and they cover 5 areas: reading, numeracy, persuasive writing, spelling, and grammar and punctuation. In 2014, the proportion of Indigenous students who met the national minimum standards in each of the 5 areas declined with increasing remoteness. For non-Indigenous students, the proportions were more similar across remoteness areas.
Years 3 and 9 students at or above the national minimum standard for reading and numeracy, by geolocation and Indigenous status, 2014
In 2012–13, labour force participation for Indigenous Australians aged 15 to 64 was significantly higher in non-remote areas (61%) than remote areas (55%). However, there was little difference in unemployment rates for Indigenous people across remoteness areas—21% in non-remote areas and 20% in remote areas.
Housing and community safety
Dwellings with structural problems were more commonly reported by Indigenous households in remote areas than in non-remote areas in 2012–13 (46% and 33%, respectively), as were dwellings with a lack of working facilities (31% and 12%).
Indigenous households in remote areas were more likely to live in overcrowded conditions. In 2011, 20% of Indigenous households in Remote areas and 39% of those in Very remote areas were living in overcrowded conditions, compared with 10% to 12% of those in non-remote areas.
Determinants of health
Among Indigenous people aged 15 and over, rates of daily smoking were significantly higher among those living in remote areas than non-remote areas (50% and 39%, respectively) in 2012–13. Rates of tobacco smoking among Indigenous adults declined in non-remote areas between 2002 and 2012–13 (a significant fall of 8 percentage points), but remained relatively stable in remote areas.
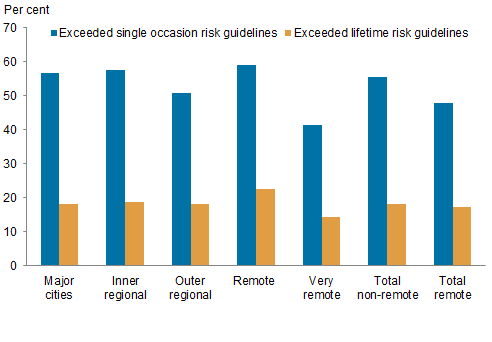
In 2012–13, Indigenous people aged 15 and over living in non-remote areas (55%) were significantly more likely to consume alcohol at single occasion risk levels than those living in remote areas (48%). However, there was no significant difference between the proportion of Indigenous people living in non-remote (18%) and remote (17%) areas who drank at levels exceeding the guidelines for lifetime risk.
Indigenous people aged 15 and over who exceeded the guidelines for alcohol consumption, by type of risk and remoteness, 2012–13
In 2012–13:
- Indigenous people aged 15 and over in non-remote areas (23%) were significantly more likely to report having used an illicit substance in the previous 12 months than those in remote areas (19%)
- Indigenous people aged 15 and over in remote areas were significantly more likely than those in non-remote areas to consume an adequate amount of fruit daily (46% compared with 41%), and significantly less likely to consume an adequate amount of vegetables daily (3% compared with 5%)
- rates of obesity among Indigenous people aged 15 and over were significantly higher in non-remote (38%) than remote (34%) areas
- Indigenous adults in remote areas were significantly more likely to have self-reported and/or measured high blood pressure than those in non-remote areas (34% and 25%, respectively)
- Indigenous adults living in remote areas were significantly more likely to have indicators of chronic kidney disease than those in non-remote areas (34% compared with 13%)
- Indigenous adults living in non-remote areas were significantly more likely to have high or very high levels of psychological distress than those in remote areas (32% and 24%, respectively).
Health and disability
In 2012–13:
- Indigenous people aged 15 and over in remote areas were significantly less likely to assess their health as fair or poor than those in non-remote areas (20% compared with 25%)
- Indigenous people aged 2 and over in remote areas were significantly more likely to report cardiovascular disease than those in non-remote areas (18% compared with 11%)
- Indigenous adults in remote areas were significantly more likely than those in non-remote areas to have diabetes (21% compared with 9.4%)
- the proportion of Indigenous Australians with severe or profound disability did not differ significantly between Indigenous people living in remote and non-remote areas (5.8% and 6.6%, respectively).
Health and welfare services
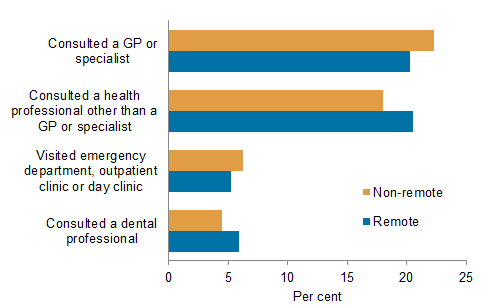
In 2012–13, similar proportions of Indigenous people in non-remote and remote areas had consulted a GP or specialist (22% and 20%, respectively) or a health professional other than a GP or specialist (18% and 21%) in the 2 weeks prior to being surveyed.
Actions taken for health in previous 2 weeks by Indigenous people, by remoteness, 2012–13
In 2012–13:
- rates of pneumococcal vaccination among Indigenous people aged 15 and over increased with remoteness (from 8% in Major cities to 24% in Very remote areas)
- there was no significant difference by remoteness in either the proportion of Indigenous women aged 18 and over reporting having a Pap test at least every 2 years, or the proportion of Indigenous women aged 40 and over reporting having regular mammograms
- 45% of Indigenous-specific primary health care organisations were located in remote areas, as were 43% of Indigenous-specific organisations providing substance-use services
- Indigenous Australians aged 2 and over living in remote areas were more likely than those in non-remote areas to have never consulted a dental professional (21% and 12%).
During the 2-year period 2010–12, Indigenous Australians living in Remote and very remote areas had higher hospitalisation rates than those in other areas.
The proportion of Community Aged Care Package (CACP) recipients at 30 June 2013 who were Indigenous increased with remoteness, from 1.4% of all CACP recipients in Major cities to 55% in Remote and very remote areas. At 30 June 2013, 84% of residential aged care services provided under the National Aboriginal and Torres Strait Islander Flexible Aged Care Program and the Multi-Purpose Service Program were located in Outer regional (41%), Remote (19%) or Very remote (25%) areas.
Expenditure and workforce
In 2010–11, per person health expenditure for Indigenous people generally increased with remoteness. For the areas of health services for which expenditure data by remoteness were available:
- expenditure was $3,899 per Indigenous person in Major cities, compared with $6,616 per Indigenous person in Remote and very remote areas
- in contrast, per person health expenditure for non-Indigenous people was more similar across the remoteness areas (ranging from $2,979 to $3,371 per person).
In 2010–11, average per person health expenditure for Indigenous people was higher than for non-Indigenous people in each remoteness area, with the ratio highest in Remote and very remote areas ($2.22 was spent for Indigenous Australians for every dollar spent for non-Indigenous Australians) and lowest in Inner regional areas ($1.14).