nKPI – clients
There were over 378,000 First Nations regular clients at June 2022 (that is, First Nations clients who had visited the organisation 3 or more times in the 2 years up to 30 June 2022). This is based on estimates provided by the organisations, and may differ from the number of First Nations regular clients reported as indicator denominators (see Data for more information).
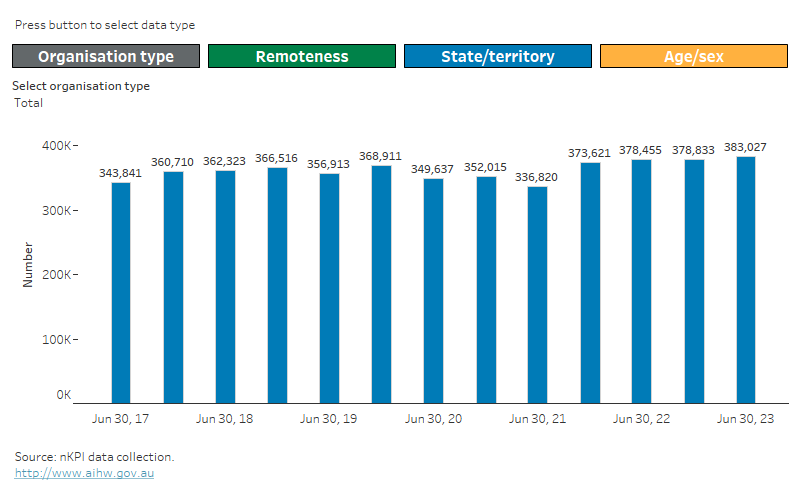
First Nations regular clients by reporting period, state/territory or remoteness, and organisation type
Indigenous regular clients, by select reporting period, select state/territory or remoteness and select organisation type
This Tableau visualisation shows the number of Indigenous regular clients by organisation type (select All, ACCHO, non-ACCHO) for either:
- state/territory (NSW/ACT, Vic, Qld, WA, SA, Tas, NT)
- remoteness area (Major cities, Inner regional, Outer regional, Remote, Very remote).
Reporting periods of either June 2017, December 2017, June 2018, December 2018, June 2019, December 2019, June 2020, December 2020, June 2021, December 2021, or June 2022 can be selected.
Data supporting this visualisation are available in Excel supplementary data tables at Archived content.

Notes
- Based on data provided on the number of First Nations regular clients with age and sex recorded.
- Includes First Nations regular clients of all ages.
- See Technical notes for more information, including on interpreting changes over time.
Of these:
- 28% (or around 107,000) were seen in Queensland
- 23% (or around 87,400) were seen in Major cities
- 84% (or around 317,000) were seen in Aboriginal Community Controlled Health Organisations (ACCHOs), of which:
- 29% (91,700) were seen in Queensland, 27% (85,400) in New South Wales/the Australian Capital Territory (combined), 16% (52,000) in the Northern Territory, 14% (45,600) in Western Australia, 8% (25,100) in Victoria/Tasmania (combined) and 5% (16,900) in South Australia
- 26% (81,300) were seen in Major cities, 22% (70,900) in Inner regional areas, 22% (69,200) in Outer regional areas, 17% (55,200) in Remote areas and 13% (40,200) in Very remote areas
- 16% (or around 61,600) were seen in organisations other than Aboriginal Community Controlled Health Organisations (non-ACCHOs), of which:
- 56% (34,800) were seen in the Northern Territory, 24% (15,000) were seen in Queensland, 13% (8,000) in New South Wales/the Australian Capital Territory (combined), 3% (1,900) in South Australia, 3% (1,600) in Victoria/Tasmania (combined) and 1% (400) in Western Australia
- 59% (36,300) were seen in Very remote areas, 14% (8,500) in Remote areas, 12% (7,200) in Inner regional areas, 10% (6,100) in Major cities and 6% (3,600) in Outer regional areas.
First Nations regular clients, age group and sex by reporting period and organisation type
Indigenous regular clients, by age group and sex and select reporting period, select organisation type
This Tableau visualisation shows the number of Indigenous regular clients by organisation type (select All, ACCHO, non-ACCHO) with a stacked bar for sex (male, female) within each age group (0–4, 5–14, 15–24, 25–34, 35–44, 45–54, 55–64, 65+).
Reporting periods of either June 2017, December 2017, June 2018, December 2018, June 2019, December 2019, June 2020, December 2020, June 2021, December 2021, or June 2022 can be selected.
Data supporting this visualisation are available in Excel supplementary data tables at Archived content.

- Prior to December 2020, results were calculated using the denominator of PI03 for First Nations regular clients aged 0–4 and the denominator of PI09 for First Nations regular clients aged 15 and over.
- From December 2020 onward, all age groups for both sexes were collected for First Nations regular clients and results are calculated using the denominator of PI03 only.
- See Technical notes for more information, including on interpreting changes over time.
At June 2022, 42% of the estimated resident First Nations population were First Nations regular clients of organisations reporting to the nKPI collection.
First Nations regular clients as a proportion of the estimated resident First Nations population, by reporting period and state/territory
Indigenous regular clients as a proportion of the estimated resident Indigenous population, by state/territory, June 2022
This Tableau visualisation shows Indigenous regular clients as a proportion of the estimated resident Indigenous population (Indigenous ERP) by state/territory (NSW/ACT, Vic, Qld, WA, SA, Tas, NT, Australia) for June 2022.
Data supporting this visualisation are available in Excel supplementary data tables at Archived content.

Notes
- In some cases clients may be counted at more than one organisation. The number of First Nations clients being greater than the First nations ERP is most common in Remote and Very remote areas.
- ERP is at 30 June of the relevant reporting period. The ERP may vary from that used for the OSR collection because of differences in reporting periods.
- Total is the sum of the states and territories and does not include external territories.
- See Technical notes for more information, including on interpreting changes over time.
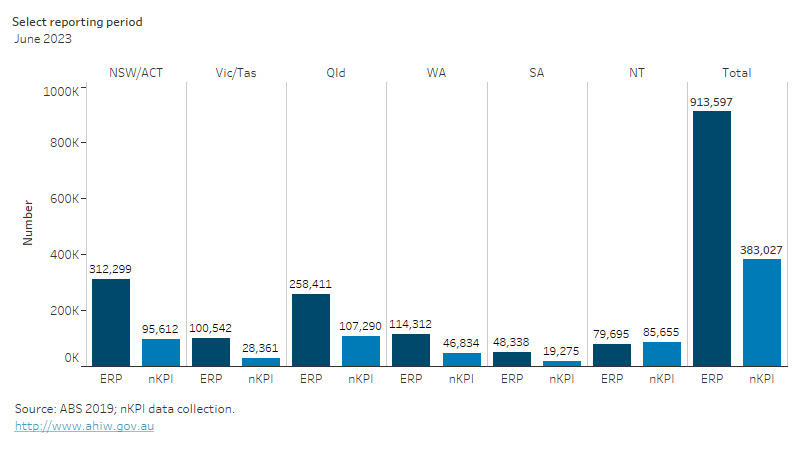
First Nations regular clients compared with the estimated resident First Nations population, by reporting period and state/territory
Indigenous regular clients compared to the estimated resident Indigenous population, by state/territory, June 2022
This Tableau visualisation shows the number of Indigenous regular clients compared with the estimated resident Indigenous population (Indigenous ERP) by state/territory (NSW/ACT, Vic, Qld, WA, SA, Tas, NT) for June 2022.
Data supporting this visualisation are available in Excel supplementary data tables at Archived content.

Notes
- In some cases clients may be counted at more than one organisation. The number of First Nations clients being greater than the First nations ERP is most common in Remote and Very remote areas.
- ERP is at 30 June of the relevant reporting period. The ERP may vary from that used for the OSR collection because of differences in reporting periods.
- Total is the sum of the states and territories and does not include external territories.
- nKPI data are based on data provided on the number of First Nations regular clients with age and sex recorded.
- ABS and nKPI data include all ages.
- See Technical notes for more information, including on interpreting changes over time.
Reference
ABS (Australian Bureau of Statistics) (2019) Estimates and Projections, Aboriginal and Torres Strait Islander Australians, 2006 to 2031 [Series B projections], ABS cat. no. 3238.0, ABS, Australian Government, accessed 3 January 2023.