Expenditure and workforce key points
Health expenditure
In 2010–11, health care expenditure for Indigenous people was estimated to be $4.6 billion, accounting for 3.7% of total recurrent health expenditure by government and non-government sources (including out-of-pocket payments by individuals). On average, health care expenditure was $7,995 per Indigenous Australian, compared with $5,437 per non-Indigenous Australian—thus $1.47 was spent on health care per Indigenous person for every $1.00 spent per non-Indigenous person.
In 2010–11, expenditure on health by governments comprised most ($4.3 billion or 95%) of total health expenditure for Indigenous Australians. Government health expenditure for Indigenous Australians comprised 5.1% of total government health expenditure.
Between 2008–09 and 2010–11, government health expenditure for Indigenous people increased by $847 per person (adjusted for inflation)—an average annual growth rate of 6.1%. The corresponding growth rate for non-Indigenous people was 2.6%.
In 2010–11, the health conditions that accounted for the largest proportion of admitted patient expenditure for Indigenous people were genitourinary diseases (which includes expenditure on dialysis), and mental and behavioural disorders (both 11% of admitted patient expenditure).
Expenditure on hospitalisations for selected conditions, by Indigenous status, 2010–11

In 2010–11, average per person expenditure for:
- Medicare Benefits Schedule benefits was lower for Indigenous Australians ($493 per person) than for non-Indigenous Australians ($737) (a ratio of 0.7)
- Pharmaceutical Benefits Scheme benefits was also lower for Indigenous Australians ($291) than for non-Indigenous Australians ($366) (a ratio of 0.8).
Among people in non-remote areas, 20% of Indigenous adults had private health insurance in 2012–13, compared with 57% of all Australian adults.
Health funding
Health funding and health expenditure are distinct but related concepts. Health expenditure refers to what is spent, and is reported in terms of who incurs the expenditure, rather than who ultimately provides the funding. Health funding refers to who provides the funds that are used to pay for health expenditure.
The Australian Government funded 45% of health expenditure for Indigenous people, state and territory governments funded 47%, and non-government sources funded 8.6% in 2010–11. This compares with 44%, 24% and 32%, respectively, of health expenditure for non-Indigenous people.
Welfare expenditure
In 2012–13, government expenditure on welfare for Indigenous Australians was an estimated $9.8 billion—accounting for 6.7% of total government welfare expenditure. On a per person basis, government welfare expenditure was $13,968 per Indigenous Australian, compared with $6,019 per non-Indigenous Australian in 2012–13—this equates to expenditure of $2.32 per Indigenous person for every $1.00 spent per non-Indigenous person.
Between 2008–09 and 2012–13, government welfare expenditure for Indigenous people increased by 13% per Indigenous person (adjusted for inflation), while it decreased by 8.2% per non-Indigenous person.
In 2012–13:
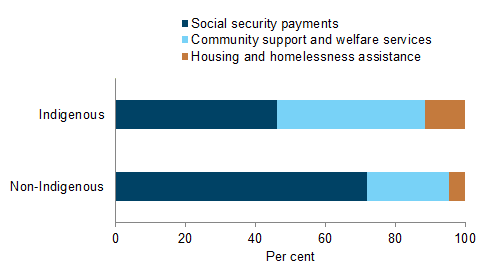
- just under half (46%) of government welfare expenditure for Indigenous people was for social security payments, followed by 42% for community support and welfare services, and 12% for housing and homelessness assistance
- of the $4.5 billion spent on social security payments for Indigenous people, nearly half (48%) was in the form of cash payments to assist families and children (compared with 26% for non-Indigenous people)
- of the $4.1 billion spent on community support and welfare services for Indigenous people, the largest proportion (29%) was spent on child protection and out-of-home care services (compared with 6.5% for non-Indigenous people)
- of the $1.1 billion spent on housing and homelessness assistance for Indigenous people, 74% was spent on social housing, 15% on rental market assistance and 12% on assistance for homeless people (compared with 34%, 59% and 6.7%, respectively, for non-Indigenous people).
Government welfare expenditure, by type of expenditure and Indigenous status, 2012–13
Indigenous people employed in health and welfare sectors
In 2011:
- there were around 8,500 Indigenous people employed in health-related occupations, representing 5.7% of all employed Indigenous people aged 15 and over; of these, one-quarter (26%) were nurses or midwives, and 15% were Indigenous health workers
- 1.6% of the Indigenous population were employed in health-related occupations compared with 3.4% of the non-Indigenous population.
In 2012, there were 221 Indigenous employed medical practitioners in Australia—accounting for 0.3% of employed medical practitioners who indicated their Indigenous status.
In 2011:
- there were 16,114 Indigenous people aged 15 and over employed in community services occupations—accounting for 3.7% of all community services workers; among these, the largest occupational groups were education aides (3,998 workers), welfare support workers (3,573 workers), and aged and disabled carers (2,672 workers)
- 2.9% of the Indigenous population were employed in the community services workforce, compared with 2.2% of the non-Indigenous population.
Differences by remoteness
In 2010–11, per person health expenditure for Indigenous people generally increased with remoteness. For the areas of health services for which expenditure data by remoteness were available:
- expenditure was $3,899 per Indigenous person in Major cities, compared with $6,616 per Indigenous person in Remote and very remote areas
- in contrast, per person health expenditure for non-Indigenous people was more similar across the remoteness areas (ranging from $2,979 to $3,371 per person).
In 2010–11, average per person health expenditure for Indigenous people was higher than for non-Indigenous people in each remoteness area, with the ratio highest in Remote and very remote areas ($2.22 was spent for Indigenous Australians for every dollar spent for non-Indigenous Australians) and lowest in Inner regional areas ($1.14).