This content contains information some readers may find distressing.

If you, or someone you know needs help, contact Lifeline on 13 11 14. Go to the crisis and support services page for a list of support services.

Accidental poisoning is caused by exposure to a substance in an amount that harms the body. It is the 9th most common reason for injury hospitalisation and leads to thousands of hospitalisations and more than a thousand deaths in Australia each year.

Accidental poisoning mostly involves pharmaceutical drugs. In this report, the term ‘pharmaceutical drugs’ includes those prescribed by a health practitioner and those obtained by other means.

Accidental poisoning resulted in around:

8,800 hospitalisations in 2021–22

34 per 100,000 population

1,400 deaths in 2020–21

5.3 per 100,000 population

This represents 1.6% of injury hospitalisations and 9.8% of injury deaths.

Intentional poisoning injuries are included under Self-harm and suicide and Assault and homicide. The adverse effects of correctly prescribed and consumed drugs are not included in this report.

Substances involved in accidental poisoning hospitalisations

In 2021–22:

  • harmful exposure to pharmaceutical drugs made up 80% of accidental poisoning hospitalisations (Table 1)
  • harmful exposure to other substances, including alcohol, organic solvents and gases, made up the other 20% of accidental poisoning hospitalisations (Table 2).
Table 1: Pharmaceuticals attributed to accidental poisoning hospitalisations, 2021–22

Type of pharmaceutical

Hospitalisations

%

Rate (per 100,000)

Other and unspecified drugs, medicaments and biological substances (includes hormones and their synthetic substitutes and antagonists, not elsewhere classified, such as insulin) (X44)

2,437

34

9.5

Antiepileptic, sedative-hypnotic, antiparkinsonism and psychotropic drugs not elsewhere classified (includes benzodiazepines and psychostimulants with potential for use disorder, such as amphetamines) (X41)

2,053

29

8

Narcotics and psychodysleptics, not elsewhere classified (includes opioids such as codeine, morphine and heroin) (X42)

1,416

20

5.5

Non-opioid analgesics, antipyretics and antirheumatic drugs (includes non-steroidal anti-inflammatory drugs (NSAIDs) (X40)

846

12

3.3

Other drugs acting on the autonomic nervous system (X43)

341

5

1.3

Total

7,093

100

28

Notes

  1. Rates are crude per 100,000 population.
  2. Percentages may not total 100 due to rounding.
  3. Codes in brackets refer to the ICD-10-AM (11th edition) external cause codes (ACCD 2019).

Source: AIHW National Hospital Morbidity Database.

For more detail, see Data tables B7–8.

Table 2: Non-pharmaceutical substances attributed to accidental poisoning hospitalisations, 2021–22

Type of non-pharmaceutical substance

Number

%

Rate (per 100,000)

Other gases and vapours (not included in X46 below), such as exhaust fumes and carbon monoxide (X47)

230

13

0.9

Alcohol (X45)

180

10

0.7

Organic solvents and halogenated hydrocarbons and their vapours (X46)

118

7

0.5

Pesticides (X48)

91

5

0.4

Other and unspecified chemicals and noxious substances (X49)

1,128

65

4.4

Total

1,747

100

6.9

Notes

  1. Rates are crude per 100,000 population.
  2. Percentages may not total 100 due to rounding.
  3. Organic solvents and halogenated hydrocarbons and their vapours include aerosol and solvent-based products such as, deodorant, hair care products, laughing gas (nitrous oxide), paint, paint thinner, glue, nail polish remover, cleaning spray, felt-tip markers, mineral turpentine, methylated spirits, and petrol.
  4. Codes in brackets refer to the ICD-10-AM (11th edition) external cause codes (ACCD 2019).

Source: AIHW National Hospital Morbidity Database.

For more detail, see Data tables B7–8.

Substances involved in accidental poisoning deaths

In 2020–21:

  • harmful exposure to pharmaceutical drugs made up 85% of accidental poisoning hospitalisations
  • alcohol was the most common non-pharmaceutical cause of accidental poisoning hospitalisations (Table 3).
Table 3: Substances involved in accidental poisoning deaths, 2020–21

Type of substance

Deaths

%

Rate (per 100,000)

Other specified and unspecified drugs, medicaments and biological substances (includes drugs acting on the autonomic nervous system, hormones and their synthetic substitutes and antagonists, not elsewhere classified, such as insulin) (X43–X44)

            727

53

2.8

Narcotics and psychodysleptics, not elsewhere classified (includes opioids such as codeine, morphine and heroin) (X42)

            196

14

0.8

Antiepileptic, sedative-hypnotic, antiparkinsonism and psychotropic drugs not elsewhere classified (includes benzodiazepines and psychostimulants with potential for use disorder, such as amphetamines) (X41)

            223

16

0.9

Alcohol (X45)

            130

10

0.5

Non-opioid analgesics, antipyretics and antirheumatic drugs (includes non-steroidal anti-inflammatory drugs (NSAIDs) (X40)

               11

1

0.0

Other and unspecified gases, vapours, chemicals and noxious substances (X46–X49)

               25

2

0.1

Other identified unspecified accidental poisoning

               53

4

0.2

Total

         1,365

100

5.3

Notes

  1. Rates are crude per 100,000 population.
  2. Percentages may not total 100 due to rounding.
  3. Codes in brackets refer to the ICD-10 external cause codes (WHO 2011).

Source: AIHW National Mortality Database.

For more detail, see Data tables E10–11.

Trends over time

Over the period from 2017–18 to 2021–22, the age-standardised rate of hospitalisations due to poisoning declined by an annual average of 5.7%. From 2012–13 to 2016–17, there was an average annual increase of 3.4%.

There is a break in the time series for hospitalisations between 2016–17 and 2017–18 due to a change in data collection methods (see the technical notes for details).

For deaths due to poisoning, the age-standardised rate for 2020–21 was 17% lower than a year earlier. Between 2011–12 and 2020–21 the rate rose and fell back to the same level. (Figure 1).

Figure 1: Accidental poisoning hospitalisations and deaths, by sex, by year

2 matching line graphs on separate tabs, 1 for hospitalisations and 1 for deaths. The 3 lines represent the trend for males, persons and females over 10 years. The reader can choose to display rate per 100,000 population or number, with the default set to rate of hospitalisations

Visualisation not available for printing

For more detail, see Data tables C1–3 and F1–4.

Seasonal differences

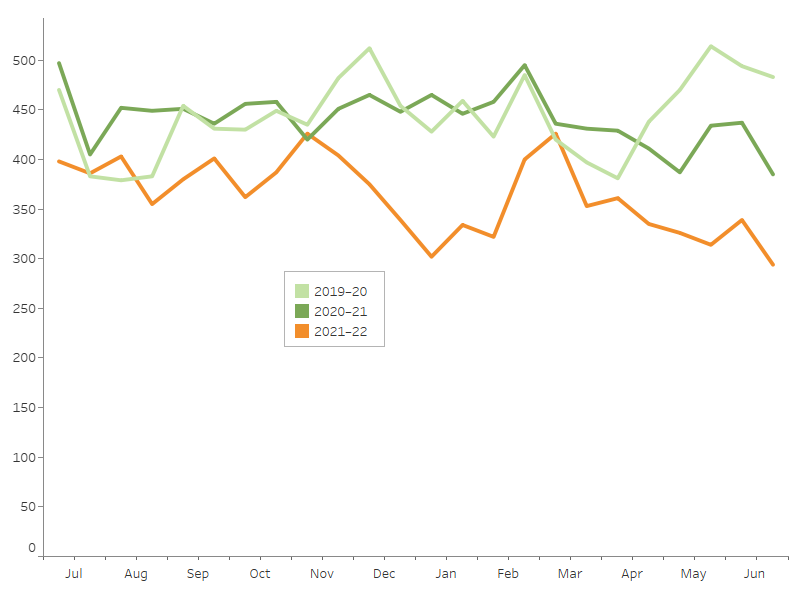
Hospitalisations due to accidental poisoning remain relatively consistent across seasons (Figure 2).

Some other types of injury show a seasonal pattern – see the interactive display.

Figure 2: Seasonal differences in accidental poisoning hospitalisations, 2019–20 to 2021–22

3 line graph representing the trends for 2019-20, 2020-21 and 2021-22

Notes

  1. Admission counts have been standardised into two 15-day periods per month.
  2. A scale up factor has been applied to June admissions to account for cases not yet separated.

Source: AIHW National Hospital Morbidity Database.

For more detail, see Data tables C1–3 and F1–4.

Age and sex differences

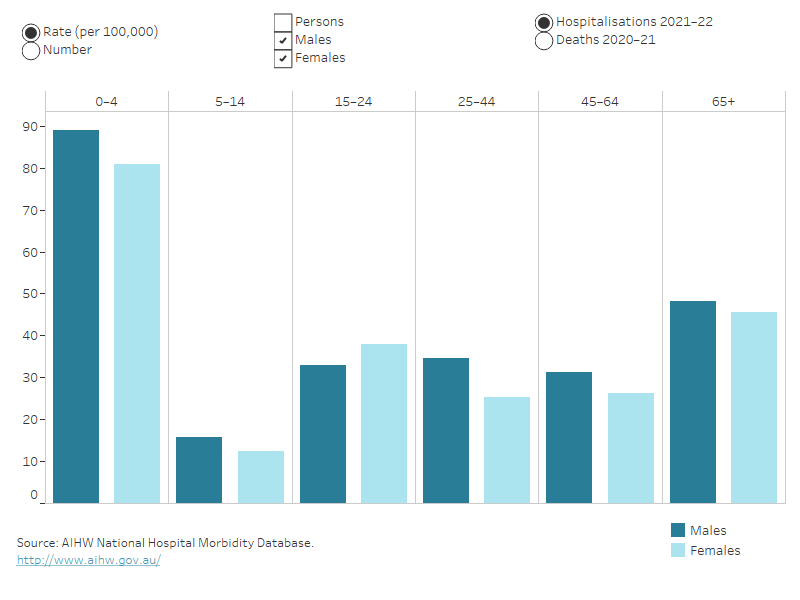
Accidental poisoning hospitalisation rates were slightly higher for males than females (in 2021–22), while the rate of death for males was more than twice the rate for females (in 2020–21).

Age patterns were very different between hospitalisations and deaths (Figure 3).

For accidental poisoning hospitalisations in 2021–22:

  • males made up a greater proportion (53%) than females
  • when comparing life-stage age groups, children aged 0–4 had the highest rate of hospitalisation (85 per 100,000 population). Further breakdown of the 65-and-over age group reveals that those aged 85 and over have similarly high rates.

For accidental poisoning deaths in 2020–21:

  • males made up a greater proportion (69%) than females
  • people aged 25–44 and 45–64 had much higher rates than other age groups (7.8 and 9.7 per 100,000 population, respectively).

Figure 3: Accidental poisoning hospitalisations and deaths, by age group and sex

Column graph representing sex within 6 life-stage age groups. The reader can choose to display either rate per 100,000 population or number. The default displays rate of hospitalisation for males and females and the reader can also choose to display persons. The reader can also choose to display deaths.

For more detail, see Data tables A1–3 and D1–3.

Severity

There are many ways that the severity, or seriousness, of an injury can be measured. Some of the ways to measure the severity of hospitalised injuries are:

  • number of days in hospital
  • time in an intensive care unit (ICU)
  • time on a ventilator
  • in-hospital deaths.

The average number of days in hospital, and the rate of in-hospital deaths for accidental poisoning were lower than the average for all injury hospitalisations, but the percentage of cases that included either time in an ICU or on continuous ventilatory support were higher (Table 4).

Table 4: Severity of accidental poisoning hospitalisation cases, 2021–22
 

Accidental poisoning

All injuries

Average number of days in hospital

2.6

4.7

% of cases with time in an ICU

8.1

2.0

% of cases involving continuous ventilatory support

5.9

1.1

In-hospital deaths (per 1,000 cases)

3.5

5.9

Note: Average number of days in hospital (length of stay) includes admissions that are transfers from 1 hospital to another or transfers from 1 admitted care type to another within the same hospital, except where care involves rehabilitation procedures.

Source: AIHW National Hospital Morbidity Database.

For more detail, see Data tables A12–13.

Aboriginal and Torres Strait Islander people

Among Aboriginal and Torres Strait Islander people:

  • there were 794 hospitalisations in 2021–22 due to accidental poisoning (Table 5)
  • the hospitalisation rate for males was 1.1 times as high as for females
  • hospitalisation rates were highest for children aged 0–4
  • there were 77 deaths due to accidental poisoning in 2020–21 (Table 6)
  • the rate of death for males was 1.3 times as high as for females
Table 5: Accidental poisoning hospitalisation by sex, Indigenous Australians, 2021–22


Males

Females

Persons

Number

413

381

794

Rate (per 100,000)

94

87

 90

Note: Persons includes cases where sex is intersex, indeterminate or missing.

Source: AIHW National Hospital Morbidity Database.

Table 6: Accidental poisoning death by sex, Indigenous Australians, 2020–21


Males

Females

Persons

Number

44

33

77

Rate (per 100,000)

12

8.7

10

Notes

  1. Rates are crude per 100,000 population.
  2. Deaths data only includes data for New South Wales, Queensland, Western Australia, South Australia, and the Northern Territory.

Source: AIHW National Hospital Morbidity Database.

For more detail, see Data tables A4–5 and D4-5.

Indigenous and non-Indigenous Australians

Indigenous Australians, compared with non-Indigenous Australians, after adjusting for differences in population age structure, were:

  • 3.1 times as likely to be hospitalised due to accidental poisoning in 2021–22 (Table 7)
  • 3.0 times as likely to die because of accidental poisoning in 2020–21 (Table 8).
Table 7: Age-standardised rates of accidental poisoning hospitalisation (per 100,000) by Indigenous status and sex, 2021–22


Males

Females

Persons

Indigenous Australians

101

 91

 96

Non-Indigenous Australians

34

29

31

Notes

  1. Rates are age-standardised to the 2001 Australian population (per 100,000).
  2. ‘Non-Indigenous Australians’ excludes cases where Indigenous status is missing or not stated.

Source: AIHW National Hospital Morbidity Database.

Table 8: Age-standardised rates of accidental poisoning death (per 100,000) by Indigenous status and sex, 2020–21


Males

Females

Persons

Indigenous Australians

16

12

14.2

Non-Indigenous Australians

7.0

2.7

4.8

Notes

  1. Rates are age-standardised to the 2001 Australian population (per 100,000).
  2. ‘Non-Indigenous Australians’ excludes cases where Indigenous status is missing or not stated.
  3. Deaths data only includes data for New South Wales, Queensland, Western Australia, South Australia, and the Northern Territory.

Source: AIHW National Mortality Database.

For more detail, see Data tables A6 and D8.

The rate of hospitalisation for accidental poisoning was highest among the 0–4 life-stage age group for both Indigenous and other Australians (Figure 4).

Deaths data are not presented here because of small numbers.

Figure 4: Accidental poisoning hospitalisations by Indigenous status, by age group and sex, 2021–22

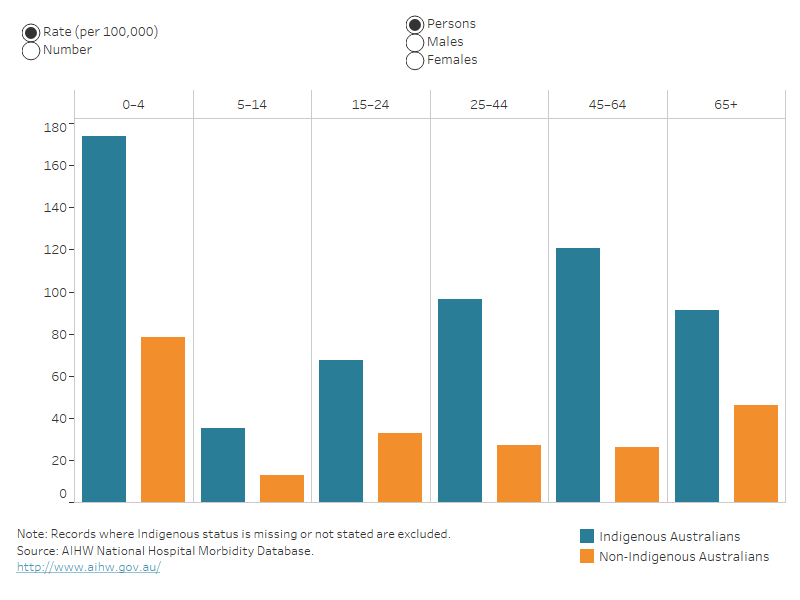
Column graph representing hospitalisation data for Indigenous and non-Indigenous Australians by 6 life-stage age groups. The reader can choose to display rate per 100,000 population or number. The reader can also choose to display data for persons, males, or females, with the default set to rate for persons.

For more detail, see Data tables A4–A6 and D4–D8.

Remoteness

In 2021–22, people living in Very remote areas had the highest rate of hospitalisation for accidental poisoning and people living in Major cities  had the lowest rate. People living in Very remote areas, using age-standardised rates, were 1.5 times as likely to be hospitalised for poisoning as those living in Major cities (Table 9).

People living in Outer regional areas had higher rates of death by accidental poisoning than those in other areas in 2020–21 (Table 10).

Table 9: Age-standardised rates of accidental poisoning hospitalisation (per 100,000) by remoteness and sex, 2021–22
 

 Males

 Females

 Persons

Major cities

               34

               30

               32

Inner regional

               35

               29

               32

Outer regional

               50

               40

               45

Remote

               36

               60

               47

Very remote

               47

               52

               49

Note: Rates are age-standardised per 100,000 population.
Source: AIHW National Hospital Morbidity Database.

Table 10: Age-standardised rates of accidental poisoning death (per 100,000) by remoteness and sex, 2020–21
 

Males

Females

Persons

Major cities

6.5

2.8

4.7

Inner regional

6.7

2.7

4.6

Outer regional

6.9

3.5

5.2

Remote

n.p.

n.p.

n.p.

Very remote

n.p.

n.p.

n.p.

n.p. not published because of small numbers, confidentiality, or other concerns about the quality of the data.
Note: Rates are age-standardised per 100,000 population.
Source: AIHW National Mortality Database.

For more detail, see Data tables A9 and D9.

The highest rate of hospitalisation for accidental poisoning was among the 0–4 life-stage age group living in Very remote areas of Australia. (Figure 5).

Deaths data are not presented because of small numbers.

Figure 5: Accidental poisoning hospitalisations by remoteness, by age group and sex, 2021–22

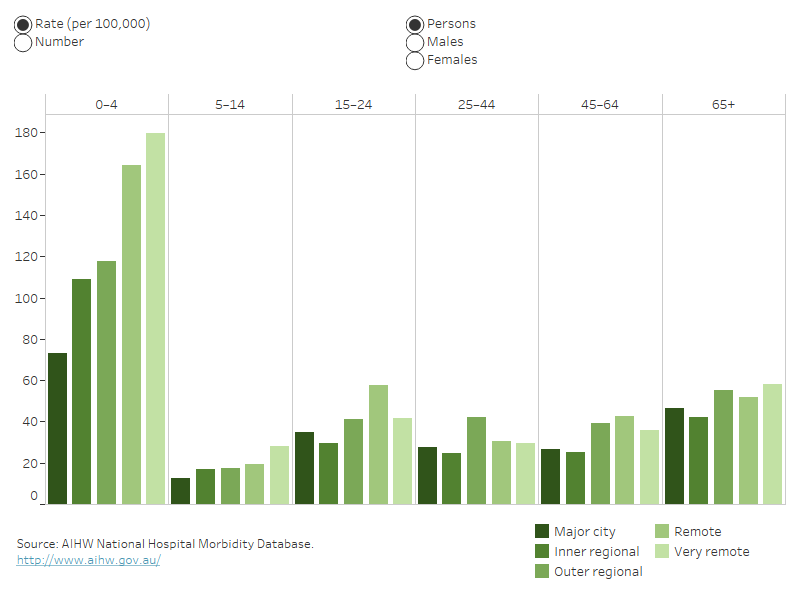
Column graph representing hospitalisation data for each of the 5 remoteness categories by 6 life-stage age groups. The reader can choose to display rate per 100,000 population or number. The reader can also choose to display data for persons, males, or females, with the default displaying rate for persons.

For more detail, see Data tables A7–A9 and D9–10.

For information on how statistics are calculated by remoteness, see the technical notes.

Data details

Technical notes: how the data were calculated

Data tables: download the full tables

Glossary