Contact with living things
Citation
AIHW
Australian Institute of Health and Welfare (2023) Contact with living things, AIHW, Australian Government, accessed 04 December 2023.
APA
Australian Institute of Health and Welfare. (2023). Contact with living things. Retrieved from https://pp.aihw.gov.au/reports/injury/contact-with-living-things
MLA
Contact with living things. Australian Institute of Health and Welfare, 06 July 2023, https://pp.aihw.gov.au/reports/injury/contact-with-living-things
Vancouver
Australian Institute of Health and Welfare. Contact with living things [Internet]. Canberra: Australian Institute of Health and Welfare, 2023 [cited 2023 Dec. 4]. Available from: https://pp.aihw.gov.au/reports/injury/contact-with-living-things
Harvard
Australian Institute of Health and Welfare (AIHW) 2023, Contact with living things, viewed 4 December 2023, https://pp.aihw.gov.au/reports/injury/contact-with-living-things
Get citations as an Endnote file: Endnote
This content contains information some readers may find distressing.
If you, or someone you know needs help, contact Lifeline on 13 11 14. Go to the crisis and support services page for a list of support services.
Injuries caused by contact with living things include bites, stings and envenomation from animals, insects and plants, along with unintentional person-to-person contact-such as while playing sport.
Injuries caused by contact with living things resulted in:
28,500 hospitalisations in 2021–22
111 per 100,000 population
27 deaths in 2020–21
0.1 per 100,000 population
This represents 5.3% of hospitalised injuries and 0.2% of injury deaths.
In medical coding terms, this topic includes exposure to animate mechanical forces, contact with venomous animals and plants and exposure to or contact with allergens: allergy to animals.
Because of the low number of deaths from contact with living things, deaths are not described further.
This category only includes unintentional injuries. Intentional harm is included under Assault and homicide.
Causes of hospitalisation
In 2021–22:
- Contact with non-venomous animals was the top cause (60%) of hospitalisations in this category (Table 1). Of these, 56% involved dogs (Table 2)
- person-to-person contact accounted for 26% of hospitalisations in this category (Table 1)
- of the 7% of hospitalisations involving venomous animals, 27% of these were due to snakes (Table 3).
Cause |
Hospitalisations |
% |
Rate (per 100,000) |
---|---|---|---|
Contact with non-venomous animals (W53–59, W61) |
17,162 |
60 |
67 |
Unintentional person-to-person contact (W50–52) |
7,441 |
26 |
29 |
Contact with venomous animals and plants (X20-29) |
2,032 |
7 |
7.9 |
Allergy to animals (Y37.6) |
1,176 |
4.1 |
4.6 |
Contact with plants (W60) |
420 |
1.5 |
1.6 |
Other and unspecified (W64) |
238 |
0.8 |
0.9 |
Total |
28,469 |
100 |
111 |
Notes
1. Rates are crude per 100,000 population.
2. Percentages may not total 100 due to rounding.
3. Codes in brackets refer to the ICD-10-AM (11th edition) external cause codes (ACCD 2019).
4. Person-to-person contact includes being hit, struck, kicked, twisted, bitten or scratched by another person, striking against or bumping into another person, and being crushed, pushed or stepped on by crowd or human stampede. Injuries involving a fall because of a collision with or pushing by another person are not included. See Falls.
Source: AIHW National Hospital Morbidity Database.
Type of animal |
Hospitalisations |
% |
Rate (per 100,000) |
---|---|---|---|
Dogs (W54) |
9,542 |
56 |
37 |
Other mammals (W55) |
4,924 |
29 |
19 |
Non-venomous snakes, lizards and other reptiles (W59) |
1,829 |
11 |
7.1 |
Non-venomous insects and arthropods (including spiders) (W57) |
544 |
3.2 |
2.1 |
Non-venomous marine animals (excluding crocodiles) (W56) |
223 |
1.3 |
0.9 |
Birds (W61) |
52 |
0.3 |
0.2 |
Rats (W53) |
22 |
0.1 |
0.1 |
Crocodiles and alligators (W58) |
26 |
0.2 |
0.1 |
Total |
17,162 |
100 |
67 |
Notes
1. Rates are crude per 100,000 population.
2. Percentages and rate may not sum to total due to rounding.
3. Codes in brackets refer to the ICD-10-AM (11th edition) external cause codes (ACCD 2019).
Source: AIHW National Hospital Morbidity Database.
Type of venomous animal |
Hospitalisations |
% |
Rate (per 100,000) |
|
---|---|---|---|---|
Snakes (X20) |
539 |
27 |
2.1 |
|
Spiders (X21) |
474 |
23 |
1.8 |
|
Bees and wasps (X23) |
201 |
10 |
0.8 |
|
Others (X22, X24–X29) |
818 |
40 |
3.2 |
|
Total |
2,032 |
100 |
7.9 |
Notes
1. Rates are crude per 100,000 population.
2. Percentages may not sum to total due to rounding.
4. Codes in brackets refer to the ICD-10-AM (11th edition) external cause codes (ACCD 2019).
Source: AIHW National Hospital Morbidity Database.
For more detail, see Data tables B19–20.
Trends over time
Over the period from 2017–18 to 2021–22, the age-standardised rate of hospitalisations due to contact with living things increased by an annual average of 0.5%. Figure 1 shows that this was largely driven by an increase among females. From 2012–13 to 2016–17 there was an average annual increase of 4.8%.
There is a break in the time series for hospitalisations between 2016–17 and 2017–18, due to a change in data collection methods (see the technical notes for details).
Figure 1: Injury hospitalisations due to contact with living things, by sex and year
Timeline graph for hospitalisations. 3 lines represent the trend for males, persons and females over 10 years. The reader can choose to display rate per 100,000 population or number.

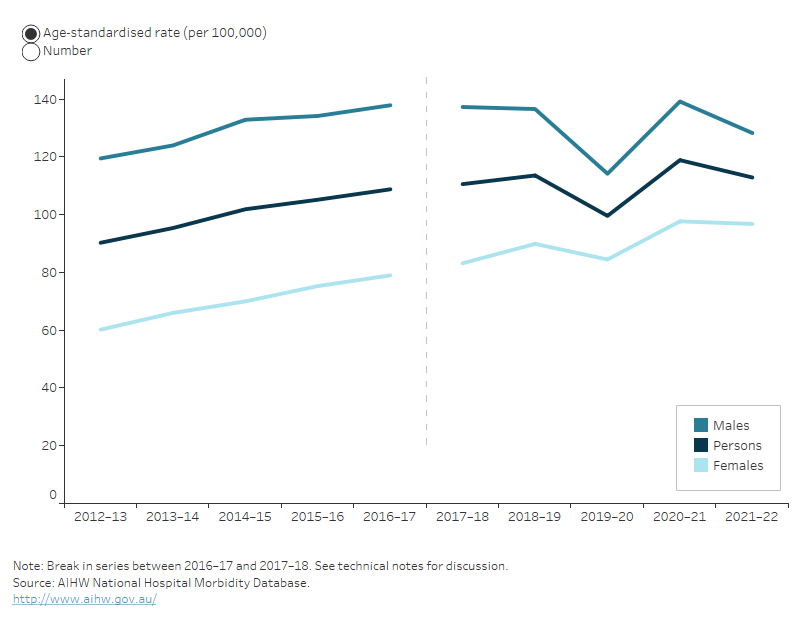
For more detail, see Data tables C1–3 and F1–4.
Seasonal differences
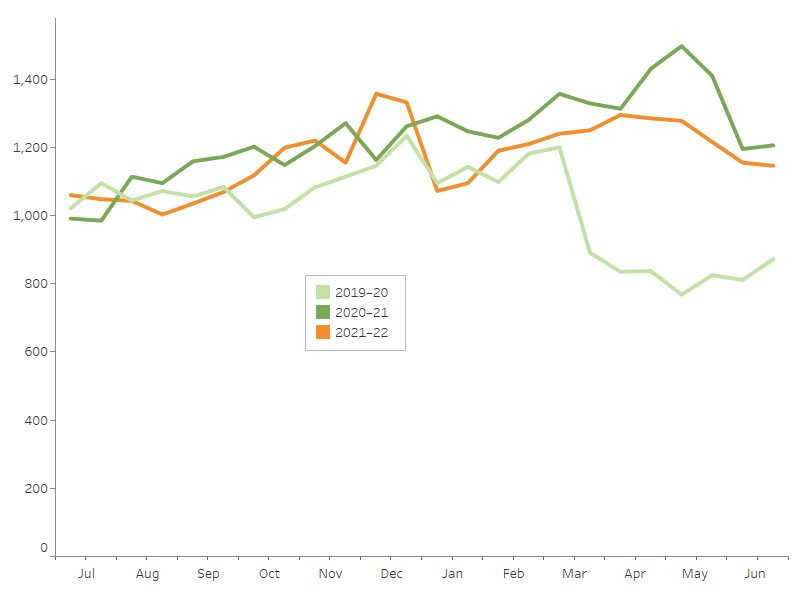
Hospitalisations due to contact with living things display a minor seasonal pattern, with peaks in summer and autumn (Figure 2).
In March 2020, COVID-19 restrictions interrupted the usual activity of Australians, coinciding with a large dip in injury hospitalisations.
The interactive display illustrates other seasonal differences in injury hospitalisations.
Figure 2: Seasonal differences in hospitalisations due to contact with living things, 2019-20 to 2021–22
Notes
1. Admission counts have been standardised into two 15-day periods per month.
2. A scale up factor has been applied to June admissions to account for cases not yet separated.
Source: AIHW National Hospital Morbidity Database.
Age and sex differences
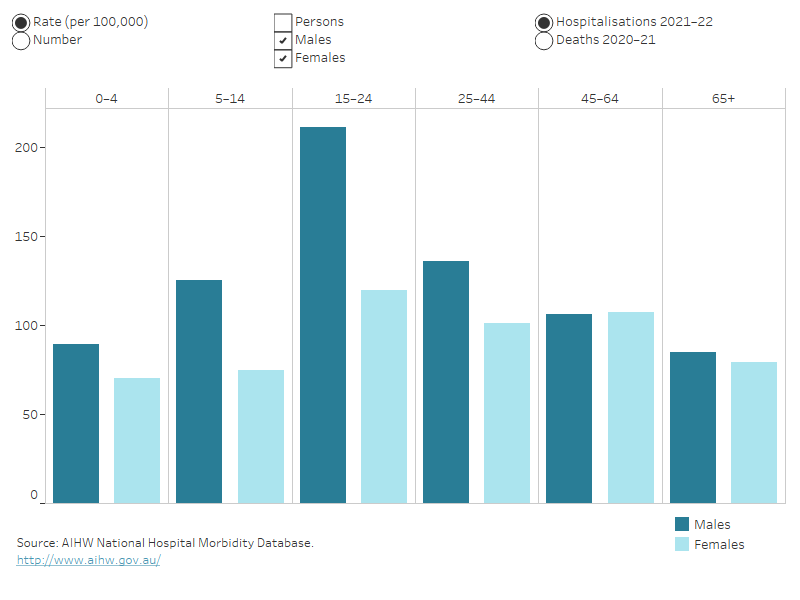
Rates of injuries caused by contact with living things differ by sex and across age groups. In 2021–22:
- 56% of the hospitalisations were for males
- the age-standardised rates of hospitalisation were 130 cases per 100,000 males, and 97 per 100,000 females
- males aged 15–24 had the highest rate of hospitalisation (Figure 3).
Figure 3: Injury hospitalisations and deaths due to contact with living things, by age group and sex, 2021–22
Column graph representing sex within 6 life-stage age groups. The reader can choose to display either rate per 100,000 population or number. The default displays rate of hospitalisations for males and females and the reader can also choose to display persons, and to display deaths.

For more detail, see Data tables B19–20.
Severity
There are many ways that the severity, or seriousness, of an injury can be assessed. Some of the ways to measure the severity of hospitalised injuries are:
- number of days in hospital
- time in an intensive care unit (ICU)
- time on a ventilator
- in-hospital deaths.
Injuries due to contact with living things appear less severe than the average for all hospitalised injuries (Table 4).
Contact with living things |
All injuries |
|
---|---|---|
Average number of days in hospital |
2.0 |
4.7 |
% of cases with time in an ICU |
0.4 |
2.0 |
% of cases involving continuous ventilatory support |
0.1 |
1.1 |
In-hospital deaths (per 1,000 cases) |
0.4 |
5.9 |
Note: Average number of days in hospital (length of stay) includes admissions that are transfers from one hospital to another or transfers from one admitted care type to another within the same hospital, except where care involves rehabilitation procedures.
Source: AIHW National Hospital Morbidity Database.
For more detail, see Data tables A13–15.
Types of injury sustained
In 2021–22, the wrist and hand was the body part most often identified as the main site of injury in hospitalisations caused by contact with living things (33%), followed by the head and neck (19%) (Figure 4).
Figure 4: Hospitalised injuries due to contact with living things, by main body part injured, 2021–22
Hover over a body part for more information:
Outline of a person with labels for body parts accounting for hospitalisation due to contact with living things. Injuries to the wrist and hand accounted for the most hospitalisations while the trunk (including spine, abdomen, and pelvis) accounted for the fewest.
Notes
- Main body part refers to the principal reason for hospitalisation.
- ‘Trunk’ includes thorax, abdomen, lower back, lumbar spine & pelvis.
- Number and percentage of injuries classified as Other, multiple, and incompletely specified body regions and Injuries not described in terms of body region not shown-see Data table A11.
Source: AIHW National Hospital Morbidity Database.
For more detail, see Data table A11.
Open wounds were the most common type of injury for people who were hospitalised due to contact with living things, followed by fractures (Figure 5).
Figure 5: Hospitalised injuries due to contact with living things, by type of injury, by sex, 2021–22
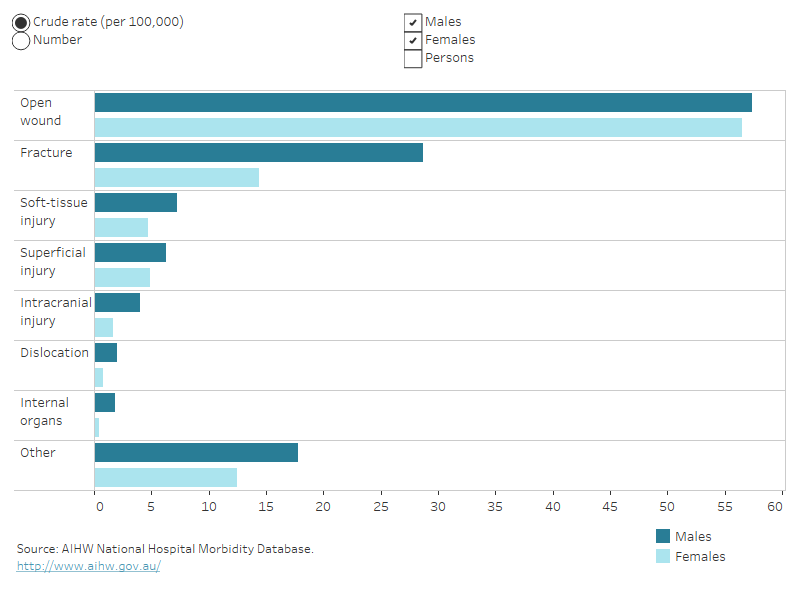
Bar graph showing type of injury sustained by category and by sex. Fracture was the most common for both males and females, followed by open wound. The reader can choose to display either the crude rate per 100,000 population or the number of cases. The default display shows data for males and females, or the reader can choose to display for persons.

For more detail, see Data table A10.
Aboriginal and Torres Strait Islander people
In 2021–22, among Aboriginal and Torres Strait Islander people:
- there were about 2,200 hospitalisations due to contact with living things, with the rate for males 1.5 times as high as for females (Table 5)
- hospitalisation rates were highest in the 25–44 and 15–24 age groups (Figure 6).
|
Males |
Females |
Persons |
---|---|---|---|
Number |
1,337 |
884 |
2,221 |
Rate (per 100,000) |
304 |
201 |
253 |
Note: Rates are crude per 100,000 population.
Source: AIHW National Hospital Morbidity Database.
Indigenous and non-Indigenous Australians
In 2021–22, Indigenous Australians, compared with non-Indigenous Australians, were 2.4 times as likely to be hospitalised due to contact with living things (Table 6).
Deaths are not compared here because of low numbers.
|
Males |
Females |
Persons |
---|---|---|---|
Indigenous Australians |
298 |
203 |
250 |
Non-Indigenous Australians |
121 |
92 |
106 |
Notes
- Rates are age-standardised per 100,000 population.
- ‘Non-Indigenous Australians’ excludes cases where Indigenous status is missing or not stated.
Source: AIHW National Hospital Morbidity Database.
Figure 6: Injury hospitalisations due to contact with living things, by Indigenous status, by age group and sex, 2021–22
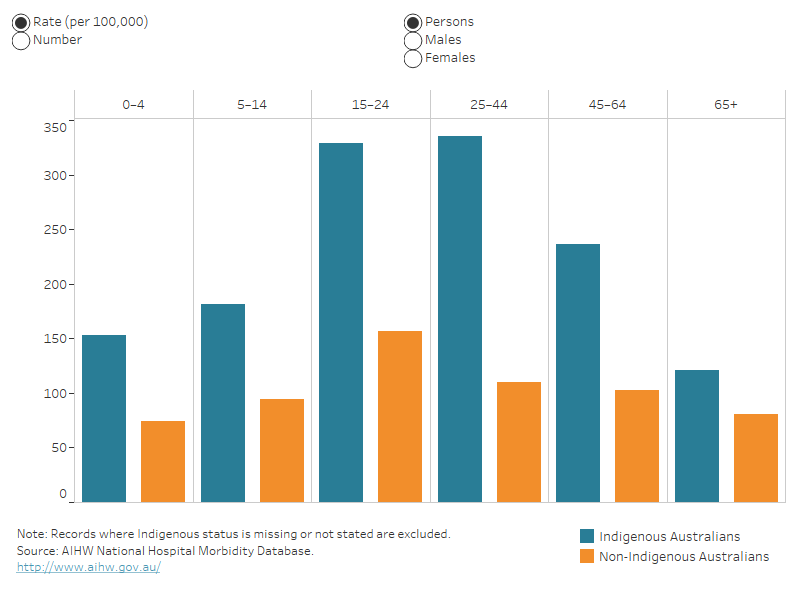
Column graph representing hospitalisation data for Indigenous and non-Indigenous Australians by 6 life-stage age groups. For each age group, the reader can choose to display rate per 100,000 population or number. The reader can also choose to display data for persons, males or females.

For more detail, see Data tables A4–6.
Remoteness
In 2021–22, people living in Australia’s Very remote areas, compared with people living in Major cities, were 3 times as likely to be hospitalised due to contact with living things (Table 7).
Deaths data are not presented because of small numbers.
Males |
Females |
Persons |
|
---|---|---|---|
Major cities |
105 |
81 |
93 |
Inner regional |
162 |
124 |
144 |
Outer regional |
208 |
143 |
176 |
Remote |
272 |
228 |
251 |
Very remote |
366 |
262 |
316 |
Note: Rates are age-standardised per 100,000 population.
Source: AIHW National Hospital Morbidity Database.
The highest age-specific rate of injury hospitalisation due to contact with living things was among the 15–24 age group living in Very remote areas of Australia. (Figure 7).
Figure 7: Injury hospitalisations caused by contact with living things, by remoteness, by age group and sex, 2021–22
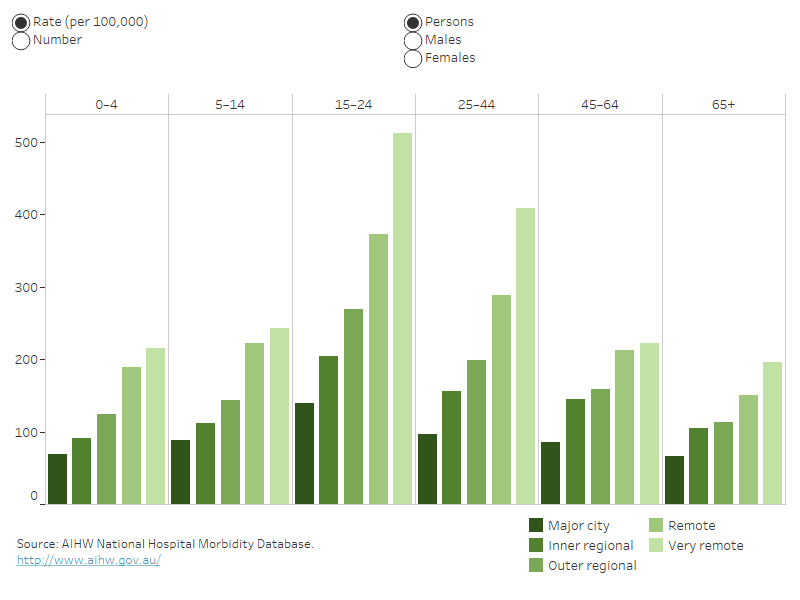
This column graph shows hospitalisations data for each of the 5 remoteness categories by 6 life-stage age groups. For each age group, the reader can choose to display rate per 100,000 population or number. The reader can also choose to display data for persons, males or females.

For more detail, see Data tables A7–9.
For information on how statistics are calculated by remoteness, see the technical notes.
Data details
Technical notes: how the data were calculated
Data tables: download full data tables
The following are publications from recent years that include information on contact with living things (referred to in most of these publications as exposure to animate mechanical forces). Search Reports for older publications.
Venomous bites and stings 2017–18
The first year of COVID-19 in Australia: direct and indirect health effects
Sports injury hospitalisations in Australia, 2019–20
Indigenous injury deaths, 2011–12 to 2015–16
Dog-related injuries (2013–14)
ACCD (Australian Consortium for Classification Development) 2019. The international statistical classification of diseases and related health problems, 10th revision, Australian modification (ICD-10-AM), 11th ed. Tabular list of diseases and alphabetic index of diseases. Adelaide: Independent Hospital Pricing Authority (IHPA), Lane Publishing.
WHO (World Health Organization) 2016. International statistical classification of diseases and related health problems, tenth revision. Fifth ed. Geneva: WHO.