This content contains information some readers may find distressing.

If you, or someone you know needs help, contact Lifeline on 13 11 14. Go to the crisis and support services page for a list of support services.

This category covers injuries caused by exposure to electric current, air pressure and temperature extremes, radiation and other human-made environmental factors. Exposure to electric current is the most common cause of hospitalisation in this category, followed by exposure to high and low air pressure and changes in air pressure.

Electricity and air pressure caused:

660 hospitalisations in 2021–22

2.6 per 100,000 population

 22 deaths in 2020–21

<0.1 per 100,000 population

This represents 0.1% of injury hospitalisations and 0.2% of injury deaths. Males are more at risk of this kind of injury.

This chapter summarises data on unintentional exposures. Intentional injuries are included under Self-harm injuries and suicide or Assault and homicide.

Deaths are relatively rare in this category so are not addressed in detail here.

Causes of hospitalisation

In 2021–22, 6 out of 10 hospitalisations (58%) in this category were caused by exposure to electric current.

Table 1: Causes of hospitalisation due to electricity and air pressure, 2021–22

Cause

Hospitalisations

%

Rate (per 100,000)

Exposure to electric current (W85–87)

381

58

1.5

Exposure to high and low air pressure and changes in air pressure (W94)

244

37

0.9

Other (W88–W93, W99)

33

5

0.1

Total

658

100

2.6

Notes

  1. Rates are crude per 100,000 population.
  2. Percentages may not total 100 due to rounding.
  3. Codes in brackets refer to the ICD-10-AM (11th edition) external cause codes (ACCD 2019).

Source: AIHW National Hospital Morbidity Database.

For more detail, see Data tables B17-18.

Trends over time

Over the period from 2017–18 to 2021–22, the age-standardised rate of hospitalisations due to electricity and air pressure decreased by an annual average of 5.5%. From 2012–13 to 2016–17 there was an average annual decrease of 2.1% (Figure 1).

There is a break in the time series for hospitalisations between 2016–17 and 2017–18, due to a change in data collection methods (see the Technical notes for details).

Figure 1: Hospitalisations and deaths from injuries caused by electricity and air pressure, by sex and year

2 matching line graphs on separate tabs, 1 for hospitalisations and 1 for deaths. The 3 lines represent the trend for males, persons and females over 10 years. The reader can choose to display age-standardised rate per 100,000 population or number, with the default set to rate.

Visualisation not available for printing

For more detail, see Data tables C1–3 and F1–4.

Seasonal differences 

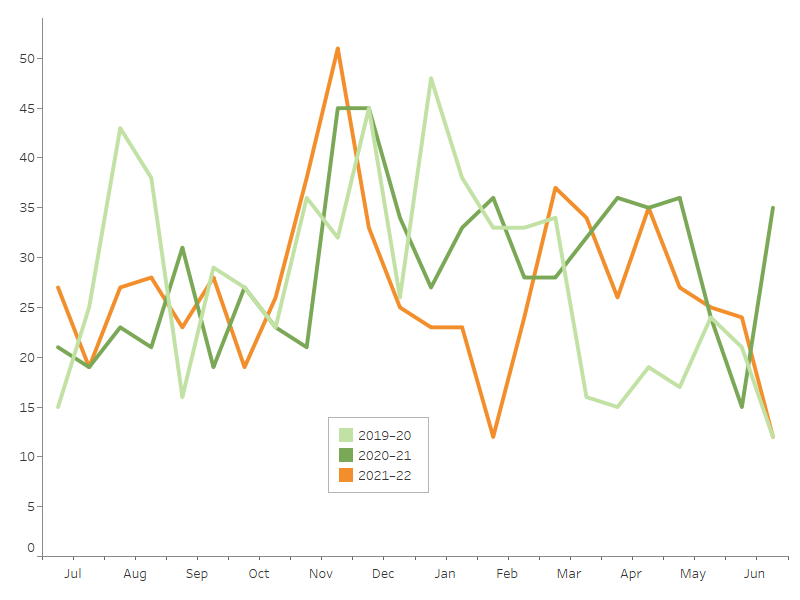
Hospitalisations for injuries due to electricity and air pressure do not show a clear seasonal pattern (Figure 2).

Some other categories of injury do show a seasonal pattern for hospitalisations. See the interactive display.

Figure 2: Seasonal differences in hospitalisations due to electricity and air pressure, 2019–20 to 2021–22

3 line graph representing the trends for 2019-20, 2020-21 and 2021-22

Notes
1. Admission counts have been standardised into two 15-day periods per month.
2. A scale up factor has been applied to June admissions to account for cases not yet separated.

Source: AIHW National Hospital Morbidity Database.

Age and sex differences

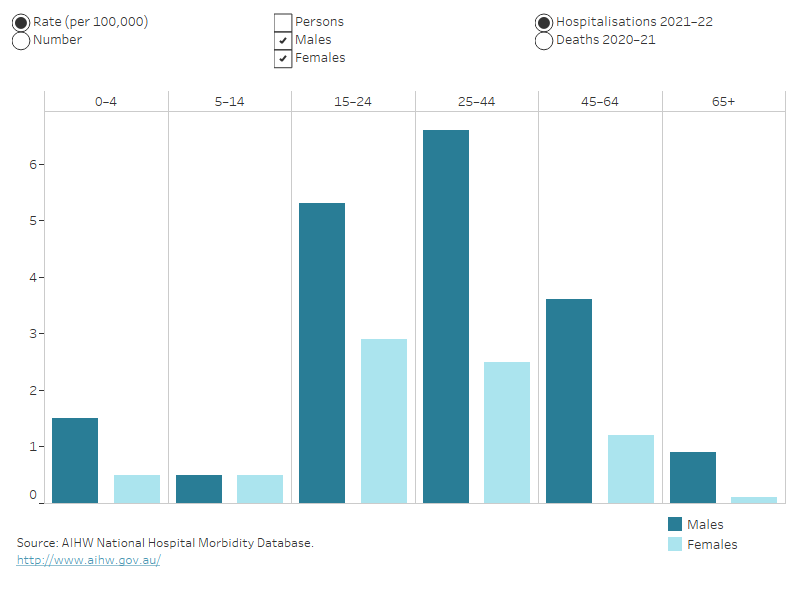
Rates of hospitalisation due to exposure to electricity and air pressure were highest in 25–44 males, and higher in people of working age as compared to those under 15 or over 65 years. For females, the highest rate was for those aged 15-24. Overall, males had 2.5 times the rate of females in 2021–22 (Figure 3).

17 of the 22 deaths were for males between the ages of 25 and 64.

Figure 3: Hospitalisations due to electricity and air pressure, by age group and sex, 2021–22

Column graph representing sex within 6 life-stage age groups. The reader can choose to display either rate per 100,000 population or number, for either hospitalisations or deaths. The default displays rate of hospitalisations for males and females and the reader can also choose to display persons.

For more detail, see Data tables A1–3 and D1–3.

Severity

There are many ways that the severity, or seriousness, of an injury can be measured. Some of the ways to measure the severity of hospitalised injuries are:

  • number of days in hospital
  • time in an intensive care unit (ICU)
  • time on a ventilator
  • in-hospital deaths.

The average number of days in hospital for injuries due to electricity and air pressure was less than the average for all hospitalised injuries, and the percentages of cases that included time in an ICU and/or involved continuous ventilatory support were similar to the average for all injuries in 2021–22. There were no in-hospital deaths. (Table 2).

Table 2: Severity of injuries caused by electricity and air pressure, 2021–22 hospitalisations
 

Electricity and air pressure

All injuries

Average number of days in hospital

2.1

4.7

% of cases with time in an ICU

1.7

2.0

% of cases involving continuous ventilatory support

1.2

1.1

In-hospital deaths (per 1,000 cases)

0.0

5.9

Note: Average number of days in hospital (length of stay) includes admissions that are transfers from 1 hospital to another or transfers from 1 admitted care type to another within the same hospital, except where care involves rehabilitation procedures.

Source: AIHW National Hospital Morbidity Database.

For more detail, see Data tables A13–15.

Data details

Technical notes: how the data were calculated

Data tables: download full data tables

Glossary