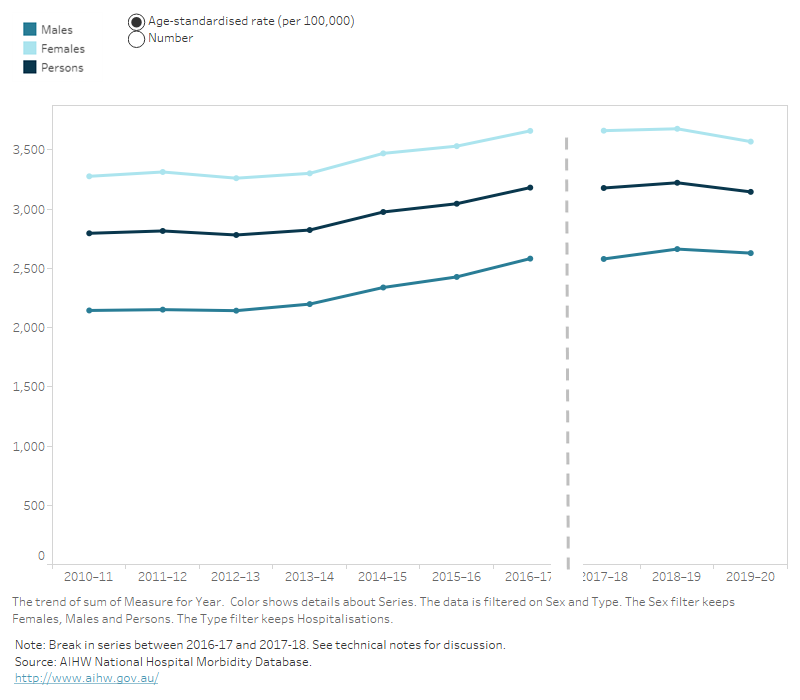
How have falls changed over time?
Line graph showing that from 2010–11 to 2016–17 there has been a gradual increase in fall hospitalisations since the break in series from 2018–19 to 2019–20 there has been a slight decrease in fall hospitalisations.
Australian Institute of Health and Welfare (2022) Falls in older Australians 2019–20: hospitalisations and deaths among people aged 65 and over, AIHW, Australian Government, accessed 20 April 2024.
Australian Institute of Health and Welfare. (2022). Falls in older Australians 2019–20: hospitalisations and deaths among people aged 65 and over. Retrieved from https://pp.aihw.gov.au/reports/injury/falls-in-older-australians-2019-20-hospitalisation
Falls in older Australians 2019–20: hospitalisations and deaths among people aged 65 and over. Australian Institute of Health and Welfare, 07 April 2022, https://pp.aihw.gov.au/reports/injury/falls-in-older-australians-2019-20-hospitalisation
Australian Institute of Health and Welfare. Falls in older Australians 2019–20: hospitalisations and deaths among people aged 65 and over [Internet]. Canberra: Australian Institute of Health and Welfare, 2022 [cited 2024 Apr. 20]. Available from: https://pp.aihw.gov.au/reports/injury/falls-in-older-australians-2019-20-hospitalisation
Australian Institute of Health and Welfare (AIHW) 2022, Falls in older Australians 2019–20: hospitalisations and deaths among people aged 65 and over, viewed 20 April 2024, https://pp.aihw.gov.au/reports/injury/falls-in-older-australians-2019-20-hospitalisation
Line graph showing that from 2010–11 to 2016–17 there has been a gradual increase in fall hospitalisations since the break in series from 2018–19 to 2019–20 there has been a slight decrease in fall hospitalisations.