Introduction
Injury
is an Australia's health
topic
Injuries are a major health care issue in Australia, and the leading cause of death for people aged 1–44.
In the latest years for which data were available, injuries in Australia accounted for:
- 8.1% of the burden of disease
- 7.6% of health expenditure.
Injuries caused around:
 538,000 hospitalisations in 2021–22
- 2,100 per 100,000 population
 13,900 deaths in 2020–21
- 54 per 100,000 population
Burden of disease measures the impact of illness and injury through time spent in ill health and premature death. In 2022, injuries were the 6th highest cause of total disease burden in Australia, accounting for 8% of total burden. Most of the injury burden (83%) was due to premature death (fatal burden), while 17% was due to years lived in ill health or with disability (non-fatal burden).
Over two-thirds (70%) of the total burden due to injuries was experienced by males, while 30% was experienced by females. Injuries accounted for 11% of total burden for males, compared to 5% for females. Suicide and self-inflicted injuries accounted for 36% of total injury burden, followed by falls (19%), poisoning (16%), road traffic injuries – motor vehicle occupants (8%), and homicide and violence (4%).
Spending on injuries is captured in the Disease expenditure database, including costs from injury hospitalisations and treatment in primary care settings. In 2019-20, a total of $140.4 billion was allocated to health conditions, of which 8% ($10.7 billion) was spent treating and managing injury. The majority occurred in hospital settings ($8.6 billion, including emergency departments and outpatient clinics), with approximately $584 million occurring in general practice, $484 million in medical imaging and $223 million in PBS expenditure. These estimates may reflect greater data capture for hospital presentations in the disease expenditure analyses, as many injuries are treated in settings such as physiotherapy or sports medicine clinics, or self managed, which may not be fully captured in these estimates.
Injury costs are reported by both the nature and cause of injury. By nature of injury (excluding ‘other’ injuries), soft tissue injuries, hip fractures, tibia and ankle fractures, dislocations, and poisoning had the highest spending. In terms of the cause of injury (excluding ‘other’ causes), spending was highest for falls, road traffic injury – motor vehicle occupants, homicide and violence, suicide and self-inflicted injuries, and road traffic injury - motorcyclists.
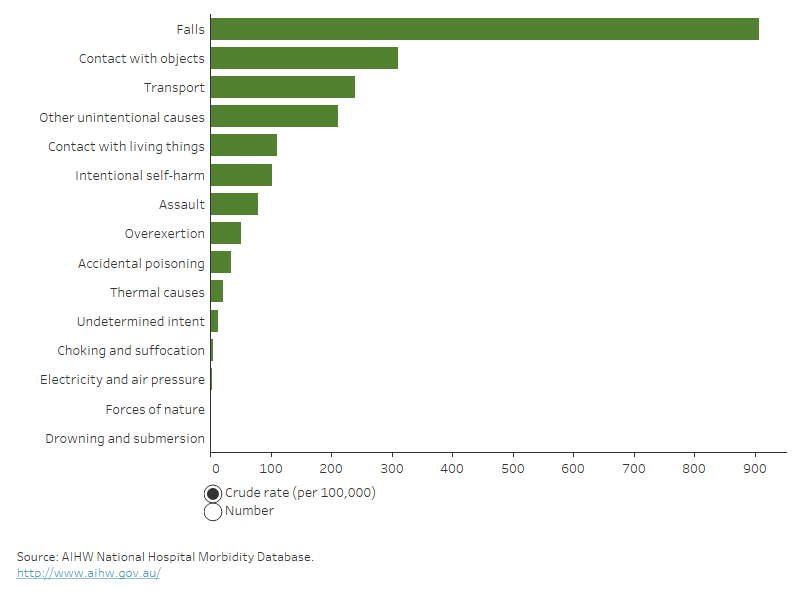
This report divides hospitalisations and deaths from injury into 15 categories, representing the main causes of injury in Australia (see Figure 1). These categories are based on the causes of injury listed in each hospital and death record.
Falls are the most common cause of both hospitalisations and deaths from injury in Australia. The next most common causes of injury leading to hospitalisation in 2021–22 were contact with objects (including blunt or sharp objects) and transport accidents. For deaths in 2020–21, the next most common causes were suicide, transport accidents and accidental poisoning.
Each of these 15 main causes of injury is explored on its own page.
Figure 1: Causes of injury hospitalisations and deaths
2 matching bar graphs on separate tabs, 1 for hospitalisations and 1 for deaths. The bars represent the 15 cause categories. The reader can choose to display either crude rate per 100,000 or number. For hospitalisations, falls shows the highest rate at 910 per 100,000.
For more detail, see data tables A1–3 and D1–3.
From 2017–18 to 2021–22 the age-standardised rate of injury hospitalisations fell marginally by an annual average of 1%. The volatility seen between 2020 and 2022 is probably related to the social disruptions caused by COVID-19. From 2012–13 to 2016–17, the rate of hospitalisations increased by an annual average of 2.8%.
There is a break in the hospitalisations time series between 2016–17 and 2017–18 due to a change in data collection methods (see the technical notes for more details).
For injury deaths, the age-standardised rate in 2020–21 was 0.6% lower than a year earlier. Between 2011–12 and 2020–21, there was an average annual increase in the rate of 0.2% (Figure 2).
Figure 2: Number and age-standardised rate of injury hospitalisations and deaths, by year
Timeline showing age-standardised rate or number of injury hospitalisations (2010-11 to 2021-22) or injury deaths (2010-11 to 2020-21) for males, persons and females. There is a break in series between 2016-17 and 2017-18
For more detail, see Data tables C1–3 and F1–4.
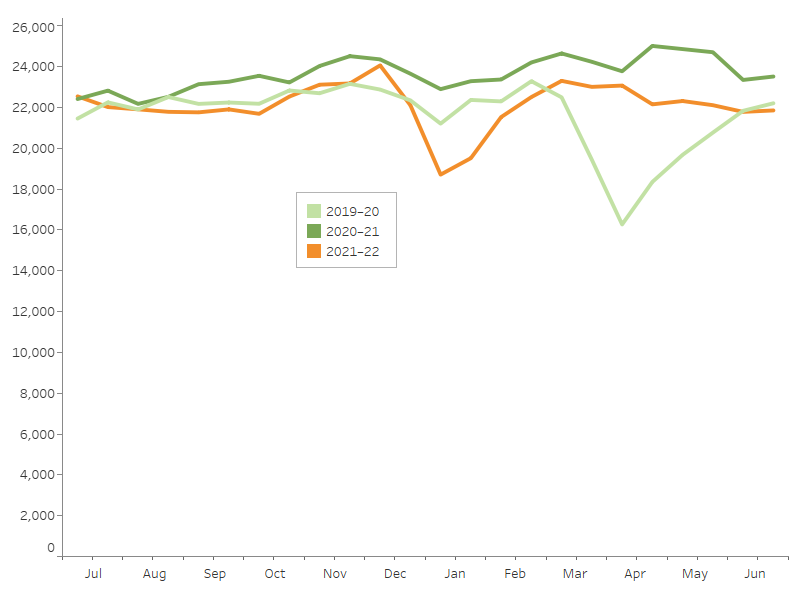
The total number of hospitalisations for injuries does not usually change much with the seasons. Data for the three most recent years suggest slightly lower numbers during July to October and a dip in January. The January dip in 2021–22 was larger than in the previous two years.
From March 2020, a range of restrictions on travel, business and social interactions were introduced in response to COVID-19. These restrictions coincided with a temporary drop in injury hospitalisations (Figure 3).
For some injury cause categories, the number of hospitalisations does change with the seasons – explore the interactive display.
Figure 3: Seasonal differences in injury hospitalisations, 2019–20 to 2021–22
Notes
1. Admission counts have been standardised into two 15-day periods per month.
2. A scale up factor has been applied to June admissions to account for cases not yet separated.
Source: AIHW National Hospital Morbidity Database.
Rates of injury differ between males and females. The extent of this difference changes over the course of life – some causes of injury are more likely to impact younger males, while other causes are more likely to impact older females.
The following sections explore these differences in age and sex, firstly for injuries overall, and then considering specific causes.
Overall, males had higher rates than females for both injury hospitalisations and deaths. For hospitalisations, males had higher rates until around age 70, above which the rates were higher for females. For deaths, male rates were higher for all age groups except for 0–4-year-olds.
Hospitalisations
In 2021–22, 54% of injury hospitalisations were for males (293,000 cases) and 46% were for females (245,000 cases). Correspondingly, the age-standardised rate of injury hospitalisation was higher for males at around 2,300 per 100,000, compared with 1,700 per 100,000 for females.
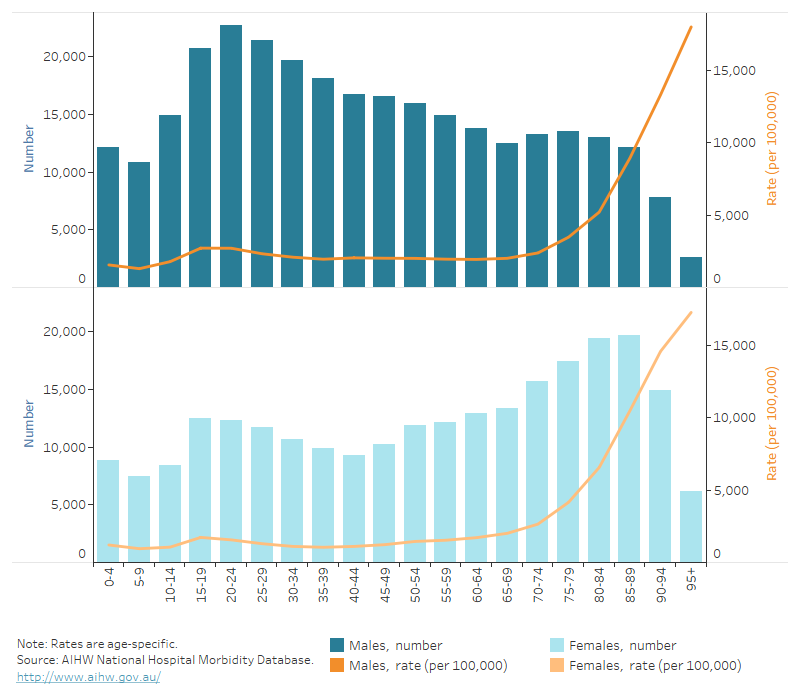
The age distribution of injuries differs between the sexes, as illustrated in Figure 4. Comparing 5-year age groups:
- the highest number of male cases was in the 20–24 age group
- the highest number of female cases was in the 85–89 age group
- rates of injury for both males and females were relatively stable during childhood and the early to middle stages of adulthood, with a small rise in the 15–19 age group
- from around age 70, rates per 100,000 rise dramatically for both males and females.
Deaths
In 2020–21, almost two thirds of injury deaths (61%) were for males (8,600 deaths) and 39% were for females (5,400 deaths). Correspondingly, the age-standardised rates of death were 63 per 100,000 males, and 31 per 100,000 females. Over half of injury deaths (56%) were for people aged 65 and over.
Comparing life-stage age groups:
- rates of injury death peaked in older age groups (ages 65 and over), and were much higher than in younger age groups for both males and females
- rates of death were higher for males than females across all life-stages except for 0–4-year-olds (Figure 4).
Figure 4: Injury hospitalisations and deaths, by age group and sex
The graph has 2 tabs, one for hospitalisations and one for deaths. Each tab has 2 dual axis column and line graphs, one graph for males and one for females. The hospitalisations graphs present data for 5-year age groups from age 0 to 4 up to age 95 and over. The columns have the same left axis which presents number of cases. The graphs have the same right axis and present rate per 100,000. Male injury numbers peak in the 20-to-24-year age band while female numbers peak at 85 to 89 years. Rates for both sexes rise notably after around age 70. The deaths graph presents data for stage-of-life age groups.
For more detail, see Data tables A1–3 and D1–3.
Cause and sex
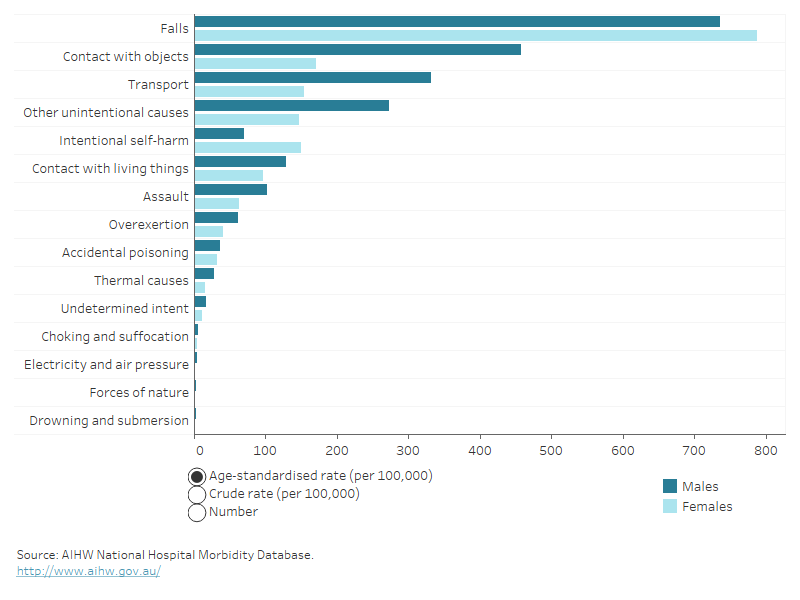
The various causes of injury tend to affect one sex more than the other, usually males more than females. Males had higher rates of injury hospitalisation across all causes except falls and intentional self-harm.
Some causes, such as accidental poisoning, showed a relatively small difference in impact between the sexes, while others showed a large difference (Figure 5).
The largest differences in hospitalisation rates in 2021–22 were from:
- forces of nature (the rate for males was 2.8 times that for females) and
- contact with objects (the rate for males was 2.7 times that for females).
Males had higher rates of injury death than females across every cause category in 2020–21. For males, the highest age-standardised rate was for suicide, while for females it was for falls.
Figure 5: Injury hospitalisations and deaths, by cause and sex
2 matching bar graphs on separate tabs, 1 for hospitalisations and 1 for deaths. The bars represent males and females in the 15 cause categories. The reader can choose to display age-standardised rate, crude rate per 100,000 or number.
For more detail, see Data tables A1–3, D1–3 and B1–34.
Cause and age
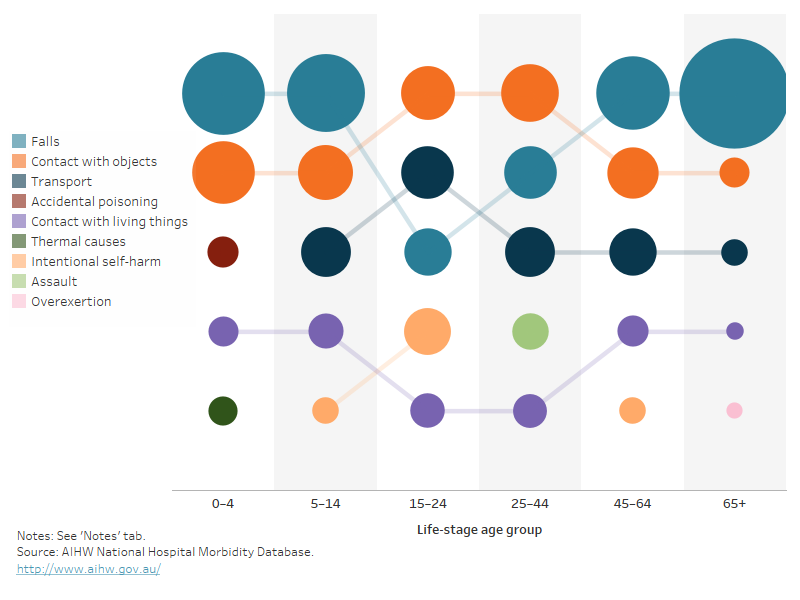
Different age groups face different injury risk factors. As a result, injuries from the various causes occur in different proportions in each age group.
For injury hospitalisations in 2021–22:
- falls and contact with objects both placed in the top 3 causes across all life-stage age groups (Figure 6)
- falls accounted for 44% of all hospitalised injuries in the 0–4 age group, 14% in the 15–24 age group and 77% for the 65-and-over group.
For injury deaths in 2020–21:
- Transport was the top cause for the two youngest age groups, suicide was the top cause for those aged between 15 and 64, and falls was the top cause for those aged 65 years and over
- falls was the cause for which the rate varied most across the life-stages, ranging from less than 1 death per 100,000 for children aged 0–4 up to 130 deaths per 100,000 for people aged 65 and over (Figure 6).
Figures 6 illustrates which causes of injury are most common for each life-stage age group. Hover over a point of interest for more detail.
Figure 6: Top 5 causes of injury leading to hospitalisation and death, by age
Bump chart showing how the causes of injury change order over life-stage age groups. Falls was the number 1 cause of hospitalisation for injury in the 0 to 4 age group, dropping to fourth in the 15 to 24 age group and then rising again to be the number 1 cause in the 65-and-over age group.
For more detail, see Data tables A1–3 and B1–34.
Each cause is discussed further on its own page.
There are many ways the severity, or seriousness, of an injury can be measured. Some of the ways to measure the severity of hospitalised injuries are:
- number of days in hospital
- time in an intensive care unit (ICU)
- time on a ventilator
- in-hospital deaths.
Average length of hospital stay
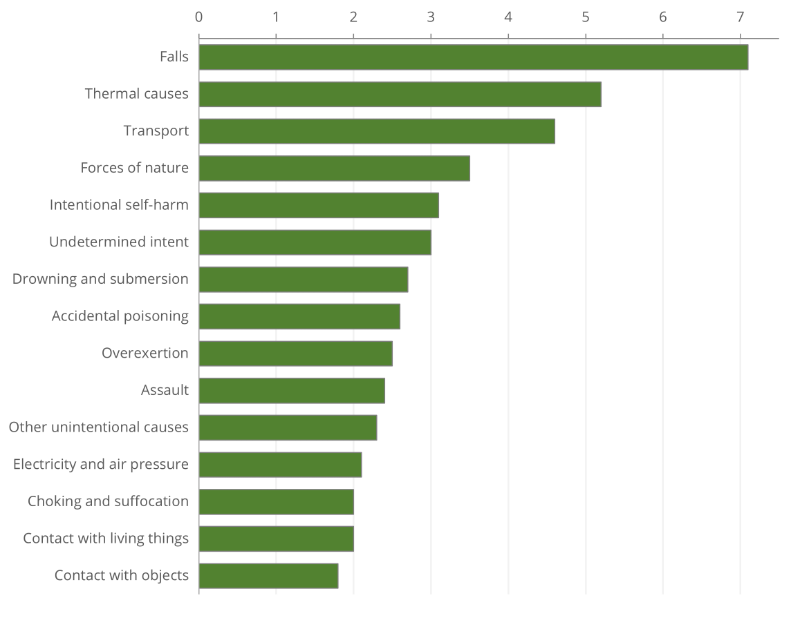
In 2021–22, the most severe injuries in terms of average number of days in hospital were due to falls (7.1 days), thermal causes (5.2 days), and transport accidents (4.6 days) (Figure 7).
The average length of stay may be influenced by the age of those injured, with younger people staying fewer days in hospital than older people across all cause categories. Older people tend to recover more slowly and are more likely to have additional health problems or complications. This particularly affects the statistics for causes with higher proportions of older people, such as falls.
Figure 7: Average number of days in hospital, by cause of injury, 2021–22
Note: Includes admissions that are transfers from 1 hospital to another or transfers from 1 admitted care type to another within the same hospital, except where care involves rehabilitation procedures.
Source: AIHW National Hospital Morbidity Database.
Intensive care
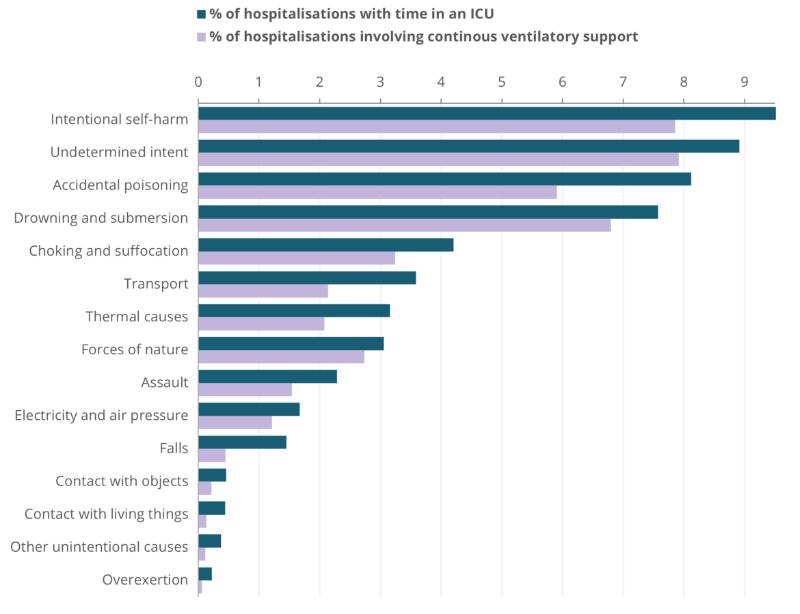
Dropping from 12,900 in 2020-21, about 10,700 injury hospitalisations (2.0% of all cases) involved a stay in an intensive care unit (ICU) in 2021–22. Injuries due to intentional self-harm, undetermined intent and accidental poisoning were most likely to result in time in an ICU (Figure 8).
Continuous ventilatory support
Continuous ventilatory support or ‘life support’, is when a patient breathes via an artificial airway with the aid of a machine.
About 6,000 injury hospitalisations (1.1% of all cases) involved continuous ventilatory support in 2021–22. Most patients needing this level of support will be in an ICU.
Injuries due to intentional self-harm, undetermined intent and drowning and submersion were most likely to result in continuous ventilatory support (Figure 8).
Figure 8: Percentage of injury hospitalisations requiring time in an ICU and continuous ventilatory support, by cause of injury, 2021–22
Source: AIHW National Hospital Morbidity Database.
In-hospital deaths
When an injured person is admitted to hospital, and dies despite the treatment provided, that can be an indication of the severity of their injuries. Figure 9 compares the causes of injury by the rate at which people died in hospital. Choking and suffocation had the highest rates of in-hospital death.
Figure 9: In-hospital deaths per 1,000 cases, by cause of injury, 2021–22
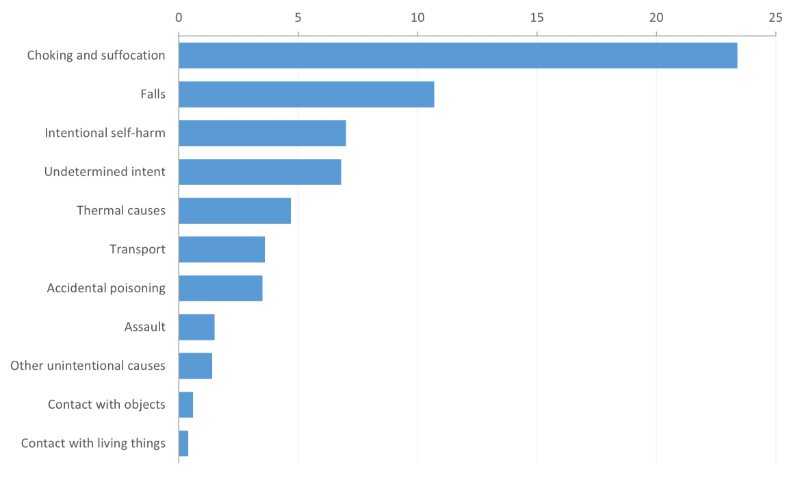
Note: Rates for the following causes were not published because of small numbers: Drowning and submersion, forces of nature, overexertion and electricity and air pressure.
Source: AIHW National Hospital Morbidity Database.
For more detail, see Data tables A13–15.
This section summarises:
- the parts of the body injured in hospitalisations and
- the main types of injury.
Body part injured
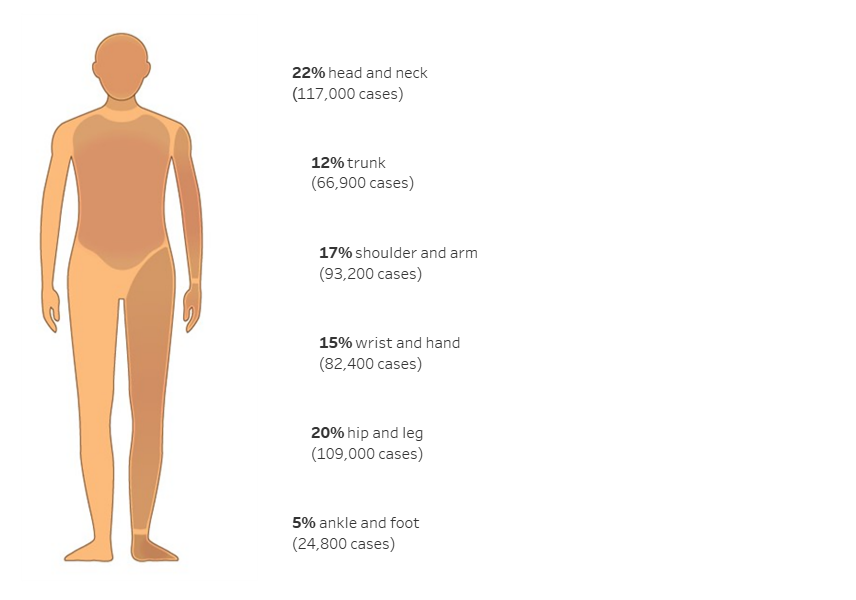
In 2021–22, the head or neck was the body part most often identified as the main site of injury in hospitalisations (Figure 10). To some extent this probably reflects the serious nature of head and neck injuries.
Figure 10: Injury hospitalisations by main body part injured, 2021–22
Outline of a person with labels for body parts accounting for hospitalisation due to all injuries. Injuries to the head and neck accounted for the most hospitalisations while the ankle and foot accounted for the fewest hospitalisations
Notes
- Main body part refers to the principal reason for hospitalisation.
- ‘Trunk’ includes thorax, abdomen, lower back, lumbar spine and pelvis.
- Number and percentage of injuries classified as Other, multiple, and incompletely specified body regions and Injuries not described in terms of body region not shown – see Data table A11.
Source: AIHW National Hospital Morbidity Database.
Different causes tend to lead to different parts of the body being injured. Figure 11 shows the three most common body parts injured for some of the most common cause categories.
Figure 11: Top 3 body parts injured as a proportion of hospitalisations, for selected causes, 2021–22
Stacked bar graph showing the most commonly injured body parts by cause of injury, as a proportion of hospitalisations. The bars represent 6 causes: falls, contact with objects, transport, assault, contact with living things, thermal causes and overexertion. For each cause, the body part most commonly injured is shown. Body parts are categorised into head and neck, hip and leg, shoulder and arm, wrist and hand, ankle and foot, trunk and other part.
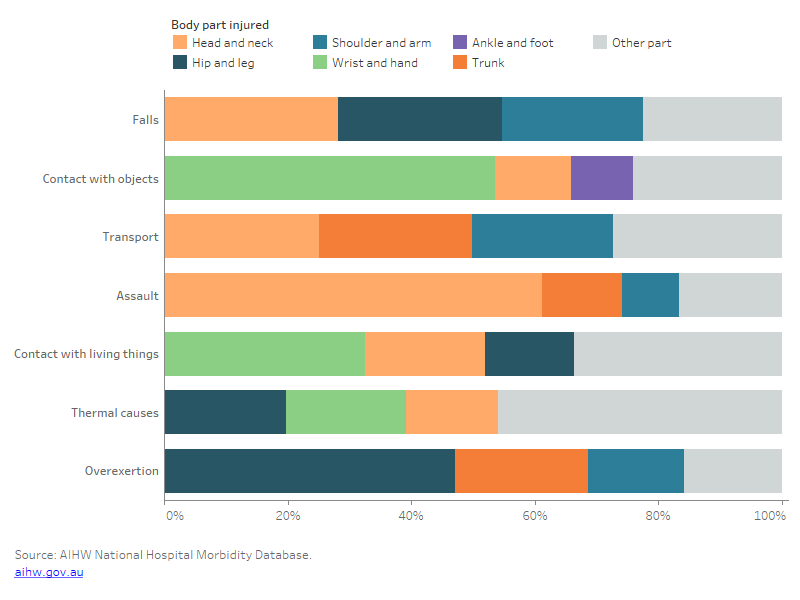
Note: ‘Trunk’ includes thorax, abdomen, lower back, lumbar spine and pelvis.
For more detail, see Data table A11.
Types of injury
Different causes tend to lead to different types of injury. Figure 12 shows the most common types of injury in hospitalisations for selected causes. Fractures were the most common type for injuries caused by falls, transport and assault, while open wounds were the most common from contact with objects and contact with living things.
Figure 12: Top 3 types of injury leading to hospitalisation as a proportion for selected causes, 2021–22
Stacked bar graph showing the top types of injuries by percentage for injury hospitalisations by selected causes. Injury types are fracture, open wound, superficial injury, soft-tissue injury, intracranial injury, poisoning and other and unspecified. Fracture is the top type of injury for hospitalisation caused by falls and open wound is the top type of injury for hospitalisation caused by contact with living things.
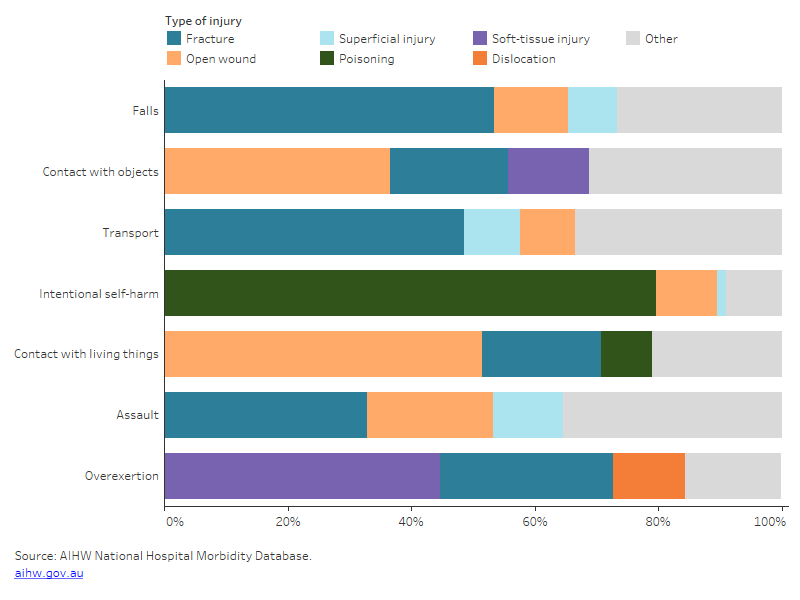
For more detail, see Data table A11.
Among Aboriginal and Torres Strait Islander people, there were 31,600 hospitalisations for injury in 2021–22, and 500 deaths in 2020–21. Falls and assault were the two most common causes of injury that led to hospitalisations (Table 1); suicide was the most common cause of injury deaths (Table 2).
Indigenous males, compared with Indigenous females were:
- 1.2 times as likely to be hospitalised due to an injury in 2021–22
- 1.9 times as likely to die from an injury in 2020–21.
Injury hospitalisation rates were highest for Indigenous Australians in the 25–44 age group (Figure 13).
| Cause | Number | % | Crude rate (per 100,000) |
|---|---|---|---|
| Falls | 7,476 | 24 | 851 |
| Assault | 6,636 | 20 | 724 |
| Contact with objects | 5,040 | 16 | 573 |
| Transport | 3.429 | 11 | 390 |
| Intentional self harm | 2,829 | 9 | 322 |
| Contact with living things | 2,221 | 7 | 253 |
| Other intentional causes | 1,758 | 6 | 200 |
| Accidental poisoning | 794 | 3 | 90 |
| Overexertion | 605 | 1.9 | 69 |
| Thermal causes | 598 | 1.9 | 69 |
| Undetermined intent | 365 | 1.2 | 42 |
| Choking and suffocation | 59 | 0.2 | 6.7 |
| Drowning and submersion | 29 | 0.1 | 3.3 |
| Forces of nature | 52 | 0.2 | 5.9 |
| Electricity and air pressure | 30 | 0.1 | 3.4 |
| All causes | 31,649 | 100 | 3,601 |
Note: All-causes total includes hospitalisations where the cause has undetermined intent or is missing, or where the cause is not elsewhere classified.
Source: AIHW National Hospital Morbidity Database.
| Cause | Number | % | Crude rate (per 100,00) |
|---|---|---|---|
| Suicide | 179 | 36 | 24 |
| Transport | 101 | 20 | 13 |
| Accidental poisoning | 77 | 15 | 10 |
| Falls | 54 | 11 | 7.1 |
| Choking and suffocation | 30 | 6 | 4 |
| Homicide | 17 | 3 | 2.2 |
| Undetermined intent | 16 | 3 | 2.1 |
| Thermal causes | 5 | 1 | 0.7 |
| All causes | 498 | 100 | 66 |
Notes
- Deaths data only includes data for New South Wales, Queensland, Western Australia, South Australia, and the Northern Territory.
- The sum of the counts by cause may be greater than the total number of injury deaths because some deaths have multiple causes.
Source: AIHW National Mortality Database.
For more detail, see Data tables A4–A6 and D4–D8.
Indigenous and non-Indigenous Australians
Indigenous Australians, compared with non-Indigenous Australians, using age-standardised rates, were:
- 2.1 times as likely to be hospitalised due to an injury in 2021–22 (Table 3)
- 1.8 times as likely to die from an injury in 2020–21 (Table 4).
The cause of injury hospitalisation with the largest difference in rates between Indigenous and non-Indigenous Australians was assault, which was 14 times as high in the Indigenous population. Rates of injury among Indigenous Australians for intentional self-harm, thermal causes, accidental poisoning, contact with living things, undetermined intent and exposure to forces of nature were all more than twice as high as those for non-Indigenous Australians (Table 3).
| Cause | Indigenous Australians | Non-indigenous Australians |
|---|---|---|
| Falls | 1,068 | 757 |
| Assault | 815 | 57 |
| Contact with objects | 560 | 302 |
| Transport | 386 | 234 |
| Intentional self harm | 319 | 100 |
| Contact with living things | 250 | 106 |
| Other intentional causes | 217 | 205 |
| Accidental poisoning | 96 | 31 |
| Overexertion | 77 | 49 |
| Thermal causes | 62 | 20 |
| Undetermined intent | 47 | 13 |
| Choking and suffocation | 7.5 | 5.2 |
| Forces of nature | 7.5 | 2.1 |
| Electricity and air pressure | 3.5 | 2.6 |
| Drowning and submersion | 2.6 | 2.1 |
| All causes | 3,919 | 1,887 |
Note:
- Rates are age-standardised per 100,000 population.
- ‘Non-Indigenous Australians’ excludes cases where Indigenous status is missing or not stated.
Source: AIHW National Hospital Mortality Database.
The cause of injury death with the largest difference in rates between Indigenous and non-Indigenous Australians was accidental poisoning, which was 3.0 times as high in the Indigenous population. Rates of death for transport accidents and suicide were also more than twice as high for Indigenous Australians (Table 4). Readers are advised to use caution when using the rates in categories with low numbers of deaths.
| Cause | Indigenous Australians | Non-Indigenous Australians | Rate ratio |
|---|---|---|---|
| Suicide | 25 | 12 | 2.1 |
| Transport | 14.6 | 5.3 | 2.8 |
| Falls | 14.3 | 16.4 | 0.9 |
| Accidental poisoning | 14.2 | 4.8 | 3.0 |
| Choking and suffocation | 6.3 | 3.9 | 1.6 |
| All causes | 84 | 46 | 1.8 |
Age standardised rates for other categories not publishable because of small numbers, confidentiality or other concerns about the quality of the data.
Notes:
- Rates are age-standardised per 100,000 population.
- Deaths data only includes data for New South Wales, Queensland, Western Australia, South Australia, and the Northern Territory.
- ‘Non-Indigenous Australians’ excludes cases where Indigenous status is missing or not stated.
Source: AIHW National Mortality Database.
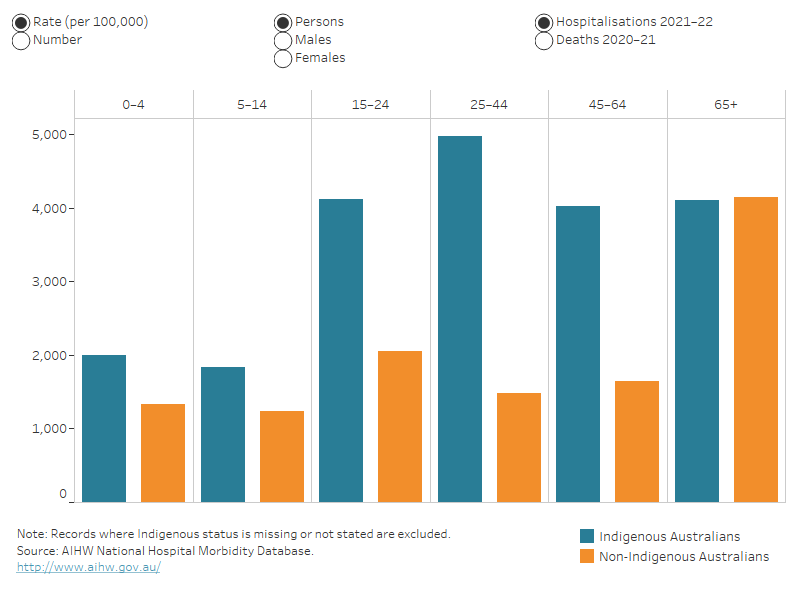
The rate of injury hospitalisations was highest among the 25–44 life-stage age group for Indigenous Australians and among the 65-and-over age group for non-Indigenous Australians (Figure 13).
Figure 13: Injury hospitalisations and deaths, by Indigenous status, sex and age group
Column graph, representing data for Indigenous and non-Indigenous Australians by 6 life-stage age groups. The reader can choose to display rate per 100,000 population or number. The reader can also choose to display data for persons, males, or females. The reader can choose to display hospitalisations or deaths. The default displays rate of hospitalisations for persons.
For more detail, see Data tables A4–6 and D4–6.
The Aboriginal and Torres Strait Islander Health Performance Framework includes a measure discussing Injury and Poisoning.
Areas of Australia which are more remote tend to have higher rates of hospitalisation and death from injury than less remote areas. People living in Very remote areas, compared with people living in Major cities, were:
- 2.2 times as likely to be hospitalised due to an injury in 2021–22 (Table 5)
- 2.2 times as likely to die from an injury in 2020–21 (Table 6).
Males | Females | Persons | |
|---|---|---|---|
Major cities | 2,089 | 1,584 | 1,844 |
Inner regional | 2,434 | 1,706 | 2,074 |
Outer regional | 2,767 | 1,948 | 2,368 |
Remote | 3,579 | 2,831 | 3,221 |
Very remote | 4,199 | 4,075 | 4,134 |
Note: Rates are age-standardised per 100,000 population.
Source: AIHW National Hospital Morbidity Database.
| Deaths (per 100,000) |
|---|---|
Major cities | 38 |
Inner regional | 53 |
Outer regional | 61 |
Remote | 70 |
Very remote | 82 |
Note: Rates are age-standardised per 100,000 population.
Source: AIHW National Mortality Database.
Cause of injury by remoteness
The cause of injury with the largest difference in hospitalisation rates between remoteness areas was assault, with the rate for Very remote areas 19 times that of Major cities (Table 7).
Cause | Major cities | Inner regional | Outer regional | Remote | Very remote |
|---|---|---|---|---|---|
Falls | 770 | 726 | 782 | 920 | 995 |
Contact with objects | 289 | 355 | 377 | 456 | 547 |
Transport | 205 | 313 | 354 | 465 | 482 |
Intentional self-harm | 99 | 115 | 149 | 175 | 191 |
Contact with living things | 93 | 144 | 176 | 251 | 316 |
Assault | 59 | 68 | 134 | 470 | 1,119 |
Overexertion | 47 | 57 | 61 | 68 | 66 |
Accidental poisoning | 32 | 32 | 45 | 47 | 49 |
Thermal causes | 17 | 27 | 40 | 67 | 101 |
Undetermined intent | 13 | 12 | 15 | 22 | 20 |
All other causes | 220 | 225 | 235 | 279 | 250 |
All causes | 1,844 | 2,074 | 2,368 | 3,221 | 4,134 |
Note: Rates are age-standardised per 100,000 population.
Source: AIHW National Hospital Mortality Database.
Age-standardised rates of death by cause of injury in Remote and Very remote areas need to interpreted with caution because of low numbers of deaths in some categories.
For further detail see Data tables A7–9 and D7–9.
Remoteness by age
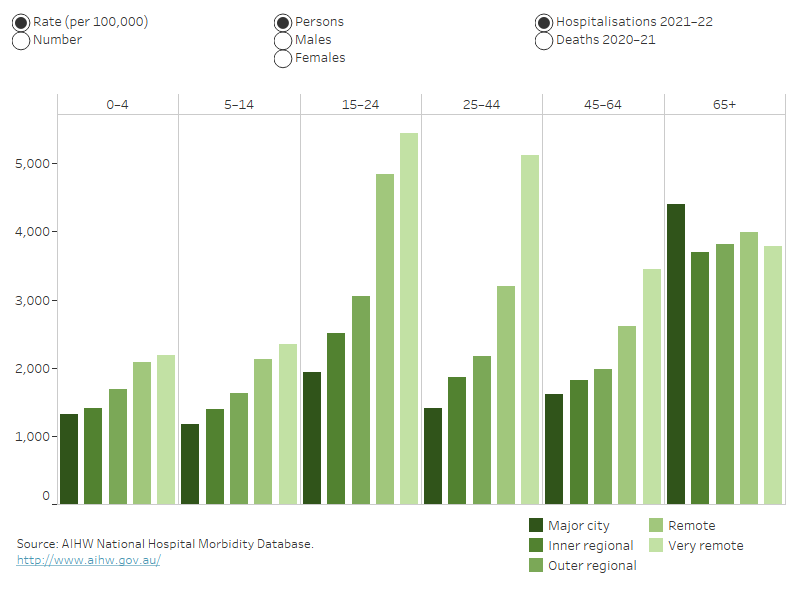
The highest rate of injury hospitalisations was among the 15–24 life-stage age group living in Very remote areas of Australia (Figure 14).
Figure 14: Injury hospitalisations and deaths, by remoteness, by age group and sex
Column graph representing data for each of the 5 remoteness categories by 6 life-stage age groups. The reader can choose to display rate per 100,000 or number. The reader can also choose to display persons, males or females, and hospitalisations or deaths. The default shows rate of hospitalisations for persons.
For more detail, see Data tables A7–9 and D9–10.
For information on how the statistics were calculated by remoteness, see the technical notes.